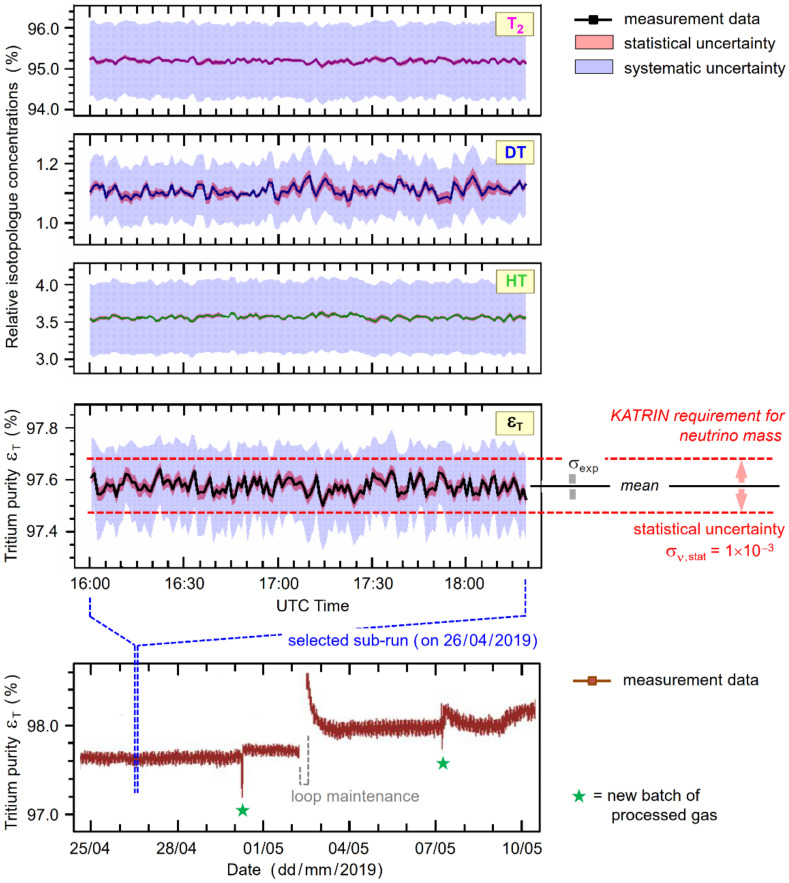
Figure 7.
Selected measurement data from KATRIN LARA during KNM1 (April—May 2019). Top panels—concentrations of the three tritiated isotopologues T2, DT, and HT (in percent of the sum of all molecular gas components); the statistical and systematic uncertainties are indicated by the colored bands. Bottom panels—derived tritium purity εT for a two-week period during KNM1 (lower data trace) and an individual sub-run (upper data trace); for the latter the statistical and systematic uncertainties are indicated by the colored bands. The statistical uncertainty limit, required for the KATRIN neutrino mass calculation, is indicated on the right. For further details, see text.

