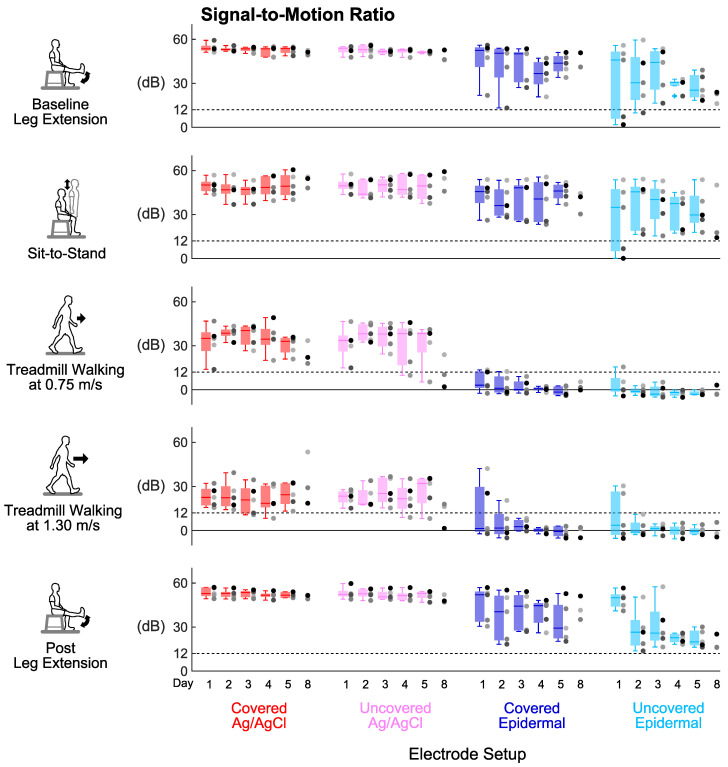
Figure 5.
Signal stability over days: Signal-to-motion ratio of each electrode setup over 8 days in different tasks. Each dot represents individual subject (n = 5 for Days 1–5, n = 3 for Day 8), and each + represents an outlier. Dashed lines mark the 12 dB threshold for an EMG signal contaminated with motion artifacts.

