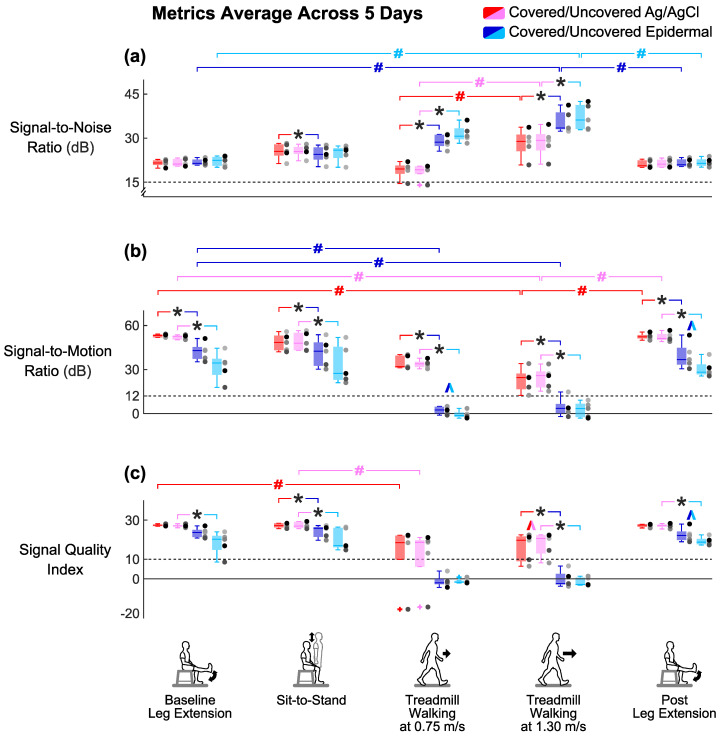
Figure 7.
(a) Group averaged signal-to-noise ratio, (b) signal-to-motion ratio, and (c) Signal Quality Index across 5 days of each electrode setup for the different tasks. Each dot represents individual subject (n = 5), and each + represents an outlier. ^: significant differences between two conditions (covered and uncovered) for the same electrode type. *: significant differences between two electrode types (Ag/AgCl and epidermal) under the same condition. #: significant differences between different tasks for the same electrode setup. Colored brackets indicate the electrode setup involved in the comparison.

