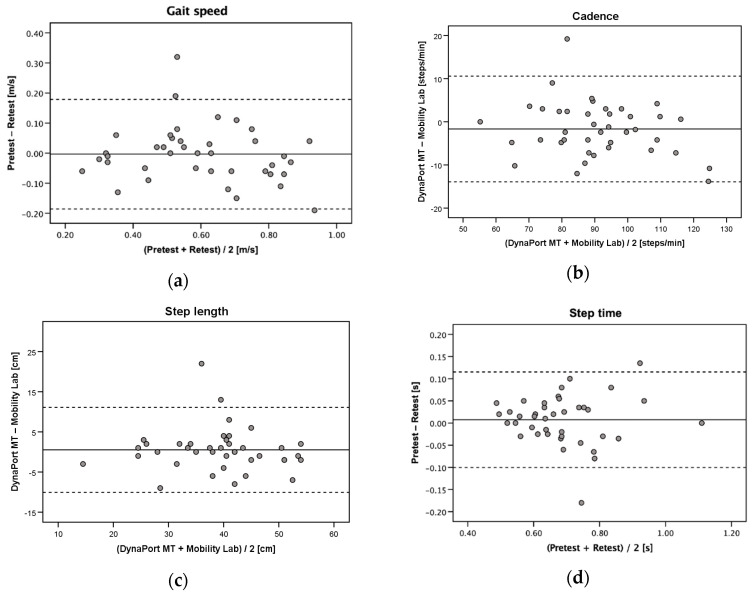
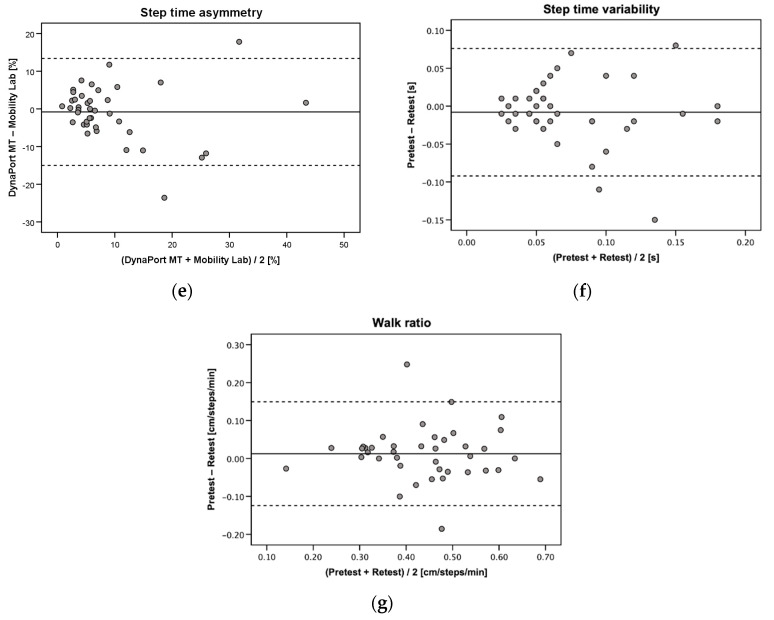
Figure 3.
Bland–Altman plots for repeated measurements of (a) gait speed, (b) cadence, (c) step length, (d) step time, (e) step time asymmetry, (f) step time variability, and (g) walk ratio with the DynaPort MT (test-retest reliability). Solid lines indicate mean test-retest differences (bias) and dashed lines indicate upper and lower 95% limits of agreement (±1.96 SD of the bias).


