Figure 4.
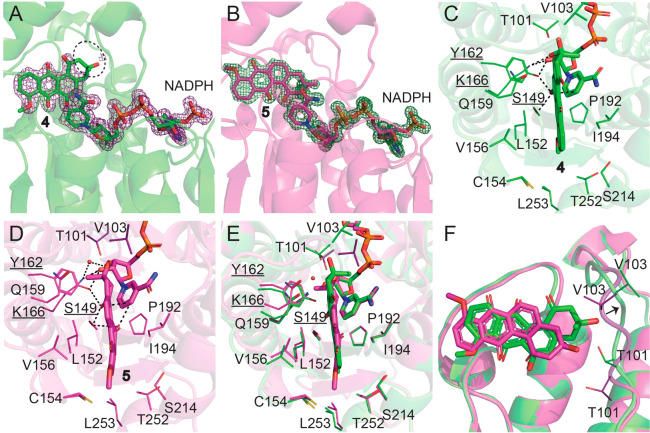
Active site of LugOII. (A, B) 2Fo – Fc omit maps contoured at the 1σ level corresponding to ligands 4 and 5 and cofactor NADPH. The missing density for 4 is highlighted with a black circle. (C, D) Key residues that surround the binding site of 4 and 5. Catalytic residues Ser149, Tyr162, and Lys166 are underlined, and their distances (within 3.2 Å) to the ligand and cofactor are dashed. (E, F) Superposition of the two substrates 4 and 5 bounded to LugOII. (E) Top view of the active pocket. (F) Side view of the two aligned substrate structures. Major differences are found in the orientations of the two substrates and the movement of the α4−β4 loop that are close to the A-rings of the two substrates. See also Figure S6.

