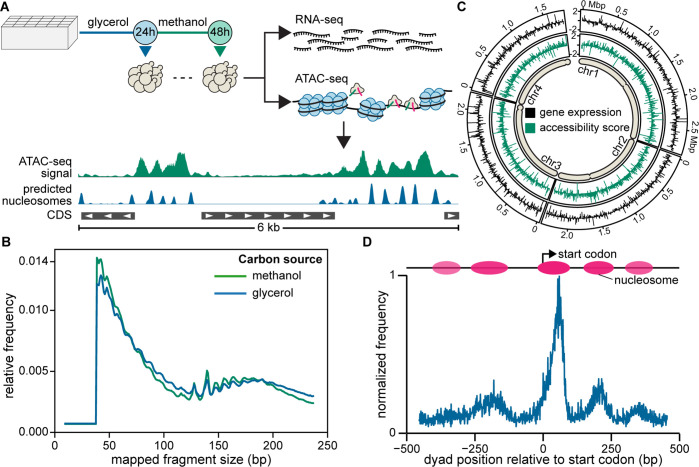
Figure 1.
Genome-wide analysis of gene expression (RNA-seq) and chromatin accessibility (ATAC-seq). (A) Workflow for cultivation and sampling for RNA-seq and ATAC-seq after 24 h growth on glycerol and an additional 24 h growth on methanol. (B) Relative frequency of mapped fragment sizes recovered in ATAC-seq libraries. (C) Log2(fold-change) in gene expression and accessibility score relative to genome-wide averages for 7.5 kbp intervals across each chromosome. Approximate positions of centromeres are depicted for each chromosome. (D) Nucleosome positioning around translation start sites in K. phaffii as determined by NucleoATAC.

