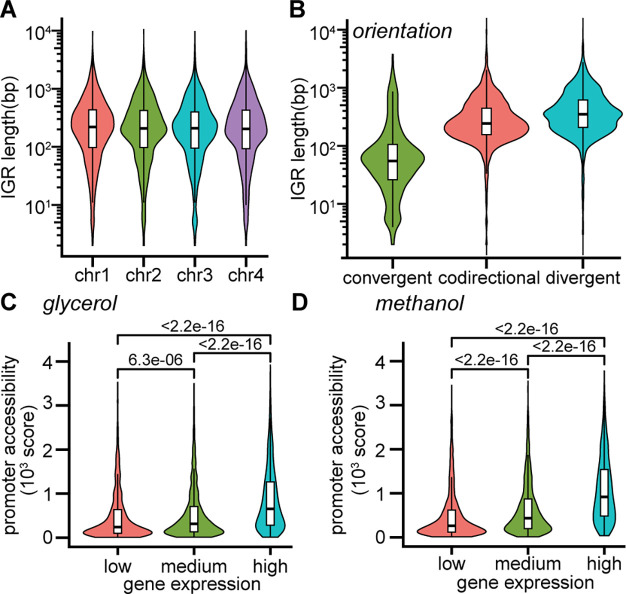
Figure 2.
Characterization of genomic properties of IGRs that potentially influence suitability for integration of a heterologous gene. (A) Distribution of intergenic region (IGR) length for each chromosome. (B) Distribution of IGR length for each orientation of adjacent genes. (C,D) Overall accessibility score in the promoter region (defined as 600 bp upstream of translation start site) for low (bottom 25%), medium (middle 50%), and high (top 25%) expression of genes under growth on (C) glycerol or (D) methanol.

