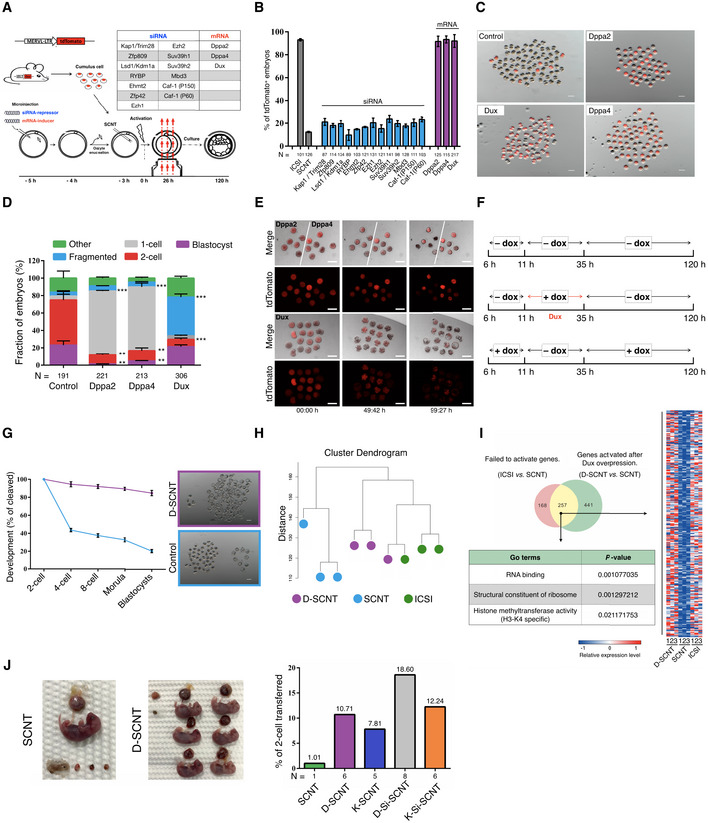
Schematic illustration of the screening strategy.
Quantification of embryos that expressing the ZGA reporter (MERVL::tdTomato) after injection with a siRNA‐repressor or mRNA‐inducer. N, the total number of embryos analyzed for each condition. Error bars, mean ± SD; n = 3 biological replicates per group.
Representative fluorescence image of SCNT embryos derived by different methods. The SCNT embryos produced by transfer of MERVL::tdTomato cumulus cells (B6D2F1 background) into WT enucleated oocytes. n = 3 biological replicates per group. Scale bar, 100 μm.
Stacked bar plots show the fraction of embryos at blastocyst stages after injection with different mRNA, as indicated. Error bars, mean ± SD; n = 3 biological replicates per group; N, total number of embryos analyzed for each condition; **P < 0.01, ***P < 0.001 as compared with control group, by two‐tailed Student's t‐test.
Representative live‐cell images of dynamic ZGA‐reporter expression during SCNT embryo development. The time after initial observation is shown at the bottom of the image. n = 3 biological replicates per group. Scale bar, 50 μm.
Schematic transient induction of Dux expression. All timings reported in this paper are hour post‐activation.
Preimplantation development of SCNT embryos. The percentage of embryos reaching each indicated stage is shown. The D‐SCNT embryos produced by transfer of dox‐Dux cumulus cell (B6D2F1 background) into WT enucleated oocytes (B6D2F1 background). Error bars, mean ± SD; n = 3 biological replicates per group. Scale bar, 100 μm.
Unsupervised hierarchical clustering.
Venn diagram showing the overlap between the genes that failed to be activated in SCNT 2‐cell embryos and derepressed in D‐SCNT. Heat map, GO terms showing the expression pattern of 257 overlapping genes.
Image of full‐term cloned mice derived by canonical SCNT and D‐SCNT method (left). The birth rate of SCNT embryos derived by different methods is indicated (right). N, the total number of cloned pups obtained from each condition.

