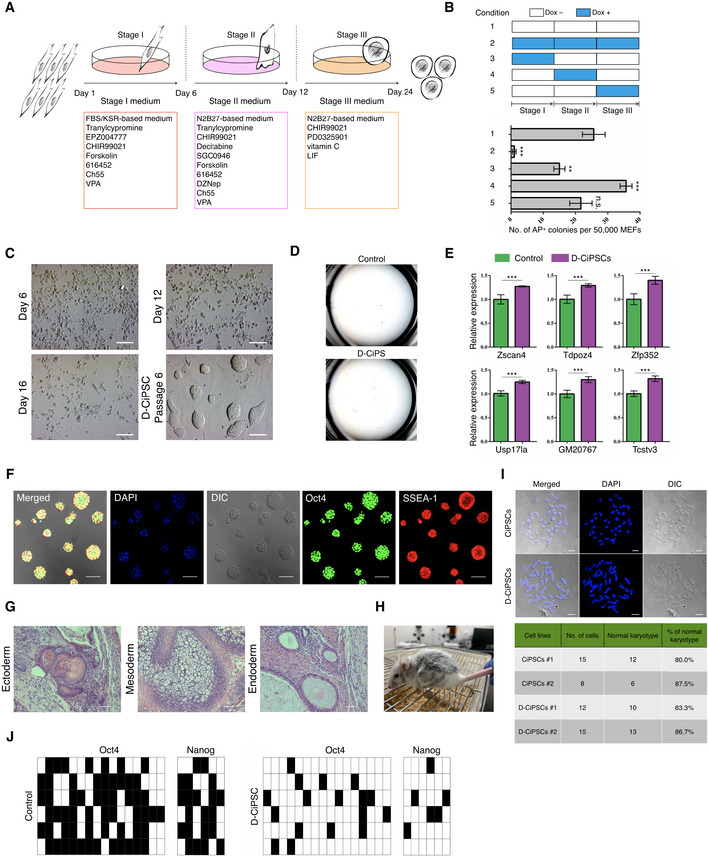
Schematic diagram for the induction of CiPSCs from MEFs using the “three‐step” method (Zhao
et al,
2018).
Durations of dox addition at different time points during chemical induction (upper) and assessment of AP+ colonies (bottom). Error bars, mean ± SD; n = 3 biological replicates per condition; **P < 0.01, ***P < 0.001 as compared with condition‐1, by two‐tailed Student's t‐test. n.s., not significant.
Morphological changes at distinct time points during D‐CiPS induction. Scale bar, 100 μm.
Representative images of the number of AP+ positive colonies. n = 5 biological replicates per condition.
RT‐qPCR analysis of select ZGA‐related genes in dox‐untreated D‐CiPSCs and canonical CiPSCs at passage 1. The value in CiPSCs was set as 1, and data shown are mean expression values relative to GAPDH. Error bars, mean ± SEM; n = 3 biological replicates per group; ***P < 0.001 by two‐tailed Student's t‐test.
Representative immunostaining images of D‐CiPSCs expressing pluripotency markers. n = 5 biological replicates. Scale bar, 50 μm.
Histology by H&E staining of teratoma tissues derived by D‐CiPS cells. n = 3 biological replicates. Scale bar, 200 μm.
Chimeric mouse generated from D‐CiPSCs.
Karyotype analysis of D‐CiPSCs and canonical CiPSCs. The majority of D‐CiPSCs and CiPSCs cells possessed a normal karyotype. Scale bar, 10 μm.
Bisulfite sequencing analysis of demethylation of Oct4 and Nanog promoters in D‐CiPSCs or canonical CiPSCs. Filled and empty squares represent methylated and unmethylated CpGs, respectively.

