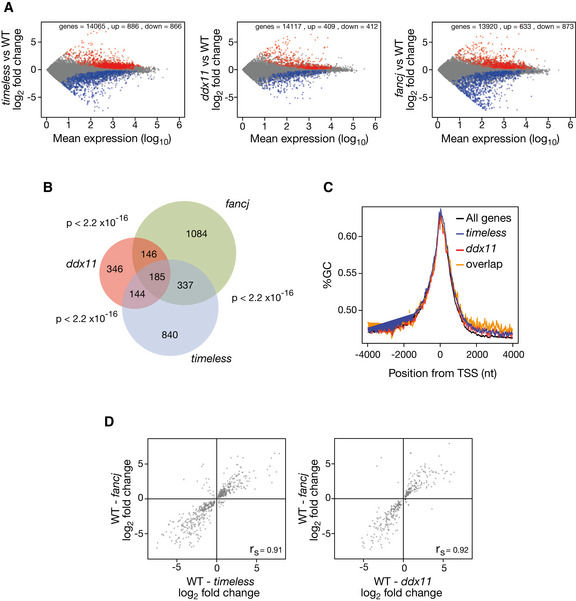
Figure EV5. Gene expression dysregulation in timeless and ddx11 DT40 cells.

- Dysregulated genes in timeless (left panel), ddx11 (centre panel) and fancj (right panel) mutants relative to wild type. All genes with > 1 transcript per million in both conditions are plotted. Significantly (P ≥ 0.95) upregulated genes shown in red; downregulated in blue.
- Venn diagram showing the overlap in genes deregulated in timeless, ddx11 and fancj relative to wild type. P < 2.2 × 10⁻¹⁶ for each pairwise comparison (Fisher hypergeometric distribution).
- GC content around the TSS in genes dysregulated in timeless (blue), ddx11 (red) and in both mutants (“overlap”, orange) compared with all genes (black).
- Correlation of magnitude and direction of change of genes dysregulated (relative to wild type) in fancj vs. timeless (left panel) and ddx11 (right panel) DT40 cells. r s (Spearman rho) is shown for each correlation.
