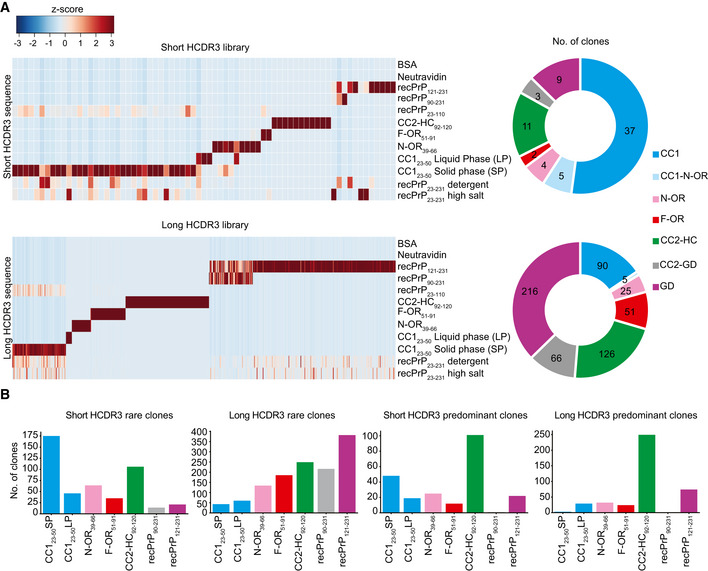
Heat maps representing enriched HCDR3 sequences across the different panning sets for the short‐ and long‐HCDR3 (upper and lower panels, respectively) phagemid libraries. HCDR3 sequences were selected based on NGS counts in 100,000 analyzed sequences (
Z‐score values;
Appendix Table S2) and clustered according to the NGS‐binding profiles. Red and blue: high and low number of NGS counts of the HCDR3 sequence, respectively. Donut charts (the right side) of each heat map indicate the number of clones with NGS‐identified HCDR3 for a predicted PrP epitope.