
Figure 5. Identification of anti‐PrP autoantibodies in an unselected hospital patient cohort.
-
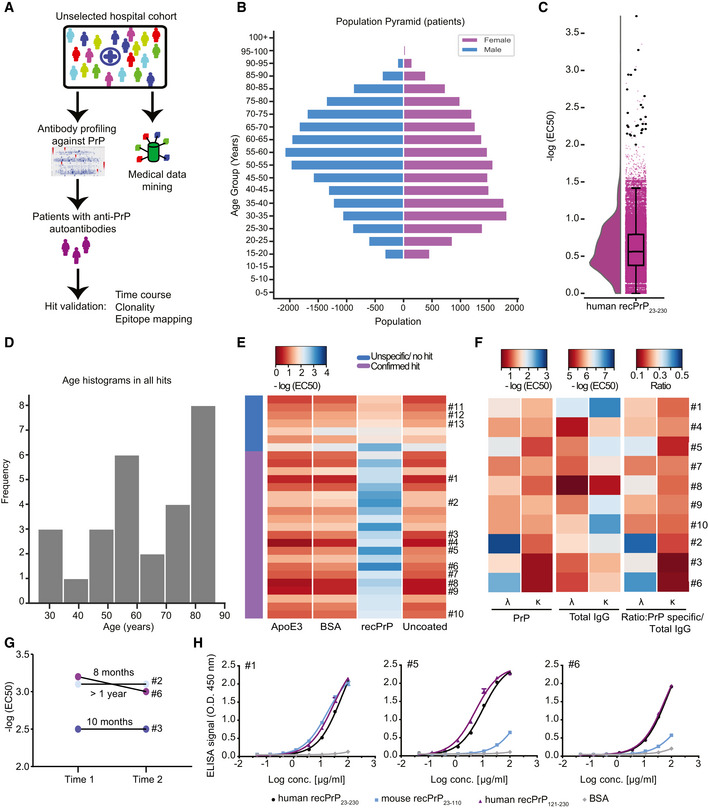
ASchematic workflow for the HTS of patient plasma samples for anti‐PrP autoantibodies.
-
BAge pyramid, separated for females and males, of the 37,894 unselected hospital patients tested in the HTS.
-
CBoxplot with half‐violin plot displaying the distribution of autoantibody reactivity in 48,718 plasma samples. Twenty‐seven samples over the reactivity threshold of −log(EC50) ≥ 2 and fitting error < 20% were considered as hits in the primary screen. Black dots correspond to single samples. The boxplot divides the dataset into three quartiles. The box extends from the first to the third quartile values of the dataset, with a line at the median. Whiskers show the range of the data (minimum and maximum).
-
DFrequency distribution of hits based on age.
-
EHeat map representation for the validation of the hits from the primary screen (21 out of 27 hits). Confirmed hits displayed selective reactivity against human recPrP23‐230. Controls: Patients #11–13, ApoE4 and BSA. Red: high reactivity; blue: low reactivity.
-
FHeat maps representing autoantibody clonality of hits analyzed by ELISA. Autoantibodies were mostly constituted by lambda light chains (λ), while the kappa light chains (κ) showed prevalence in the total IgG fraction.
-
GDetermination of antibody reactivity (‐log(EC50)) for three individuals at two different time points. Individuals were selected by displaying strong anti‐PrP IgG reactivity in the first test (Time 1). Reactivity was maintained for even more than one year (Time 2).
-
HPurified IgGs from patients with strong anti‐PrP reactivity were tested against PrP variants and BSA (negative control) in dose‐dependent ELISAs. Patient #5 and Patient #6 showed binding mostly to the human recPrP121‐230. Patient #1 displayed a polyreactive pattern with binding to the human recPrP121‐230 and mouse recPrP23–110.
Data information: ELISA data were performed in duplicates. Data represent the mean ± sem.