-
A
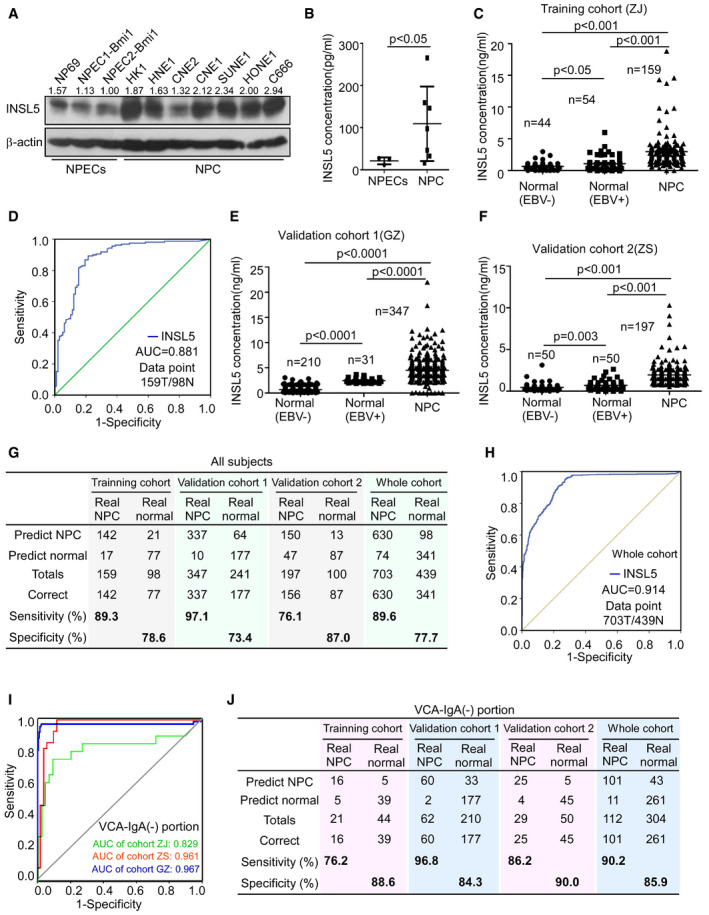
Western blotting showing cellular INSL5 in the immortalized NPEC and NPC cell lines after inhibition of protein secretion by BFA, and β‐actin was used as a loading control.
-
B
ELISA assay showing secreted INSL5 in the supernatants of NPECs and NPC cell lines. For NPECs, n = 3; for NPC, n = 7.
-
C
The concentration of plasma INSL5 in healthy controls (normal EBV (−)), non‐tumor individuals with VCA‐IgA positive (normal EBV (+)), and NPC patients, in training cohort.
-
D
ROC of the diagnostic prediction model with plasma INSL5 level in the training cohort.
-
E
The concentration of plasma INSL5 in healthy controls (normal EBV (−)), non‐tumor individuals with VCA‐IgA positive (normal EBV (+)), and NPC patients, in validation cohort 1(GZ).
-
F
The concentration of plasma INSL5 in healthy controls (normal EBV (−)), non‐tumor individuals with VCA‐IgA positive (normal EBV (+)), and NPC patients, in validation cohort 2(ZS).
-
G
Confusion table of binary results of the diagnostic prediction model in the training cohort, validation cohorts, and the whole cohort.
-
H
ROC of the diagnostic prediction model with plasma INSL5 level in the whole cohort.
-
I
ROC of the diagnostic prediction model with plasma INSL5 level in individuals with VCA‐IgA‐negative plasma in all three cohorts.
-
J
Confusion table of binary results of the diagnostic prediction model in VCA‐IgA‐negative individuals in the training cohort, validation cohorts, and the whole cohort.
Data information: In (B), data are presented as mean ± SD, in (C, E and F), data are presented as mean ± SEM, and
‐test. *
0.001, ns, no significance. Exact
.

