-
A
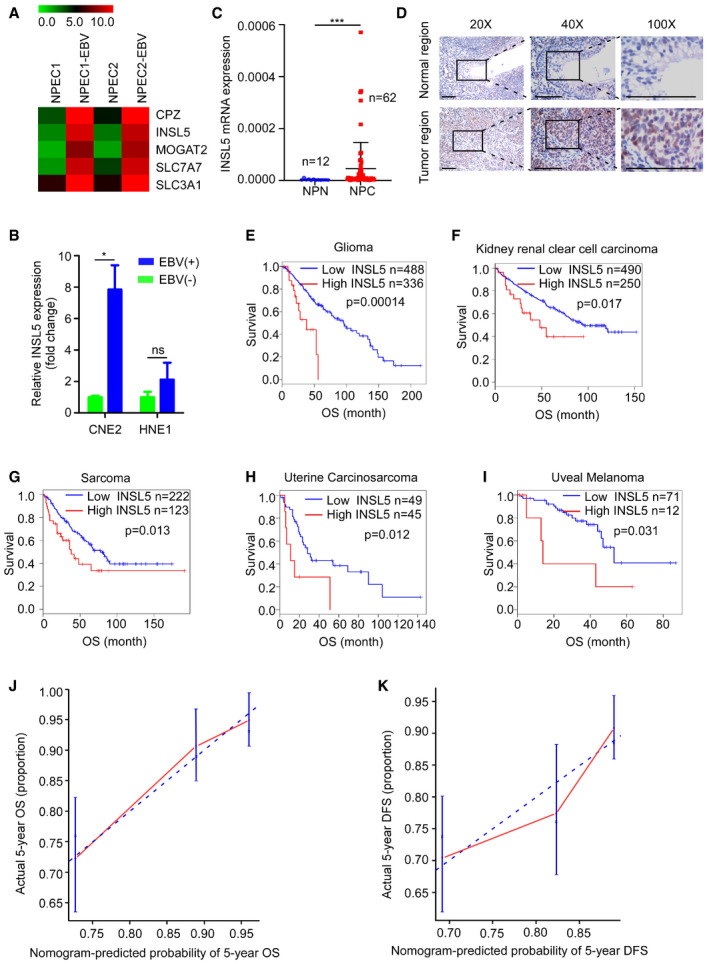
Heat map of upregulated metabolism‐associated genes after EBV infection.
-
B
mRNA expression of INSL5 in EBV‐positive and EBV‐negative NPC cell lines.
-
C
Quantitative RT–PCR showing the expression of INSL5 mRNA in normal nasopharyngeal tissues (NPN) and tumor tissues (NPC).
-
D
Representative immunohistochemical (IHC) staining of INSL5 in NPC paraffin samples. Scale bars represent 100 μm.
-
E–I
Kaplan–Meier curves showing the impact of INSL5 expression on overall survival for glioma, kidney renal clear cell carcinoma, sarcoma, uterine carcinosarcoma, and uveal melanoma (GEPIA database). Analysis of TCGA data indicates that high expression of INSL5 was correlated with poor prognosis in these cancer types.
-
J–K
The calibration curve of nomogram for predicting overall survival (OS) at 5 years (J) and predicting disease‐free survival (DFS) at 5 years (K). Actual OS or DFS is plotted on the y‐axis; nomogram predicted probability of OS or DFS is plotted on the x‐axis.
Data information: In (B), data are presented as mean ± SEM, in (C), data are presented as mean ± SD, from three different experiments, and
P‐values were determined by unpaired
t‐test. *
P <
0.05, **
P <
0.01, ***
P <
0.001, ns, no significance. Exact
P‐values are specified in
Appendix Table S4.
Source data are available online for this figure.

