-
A–C
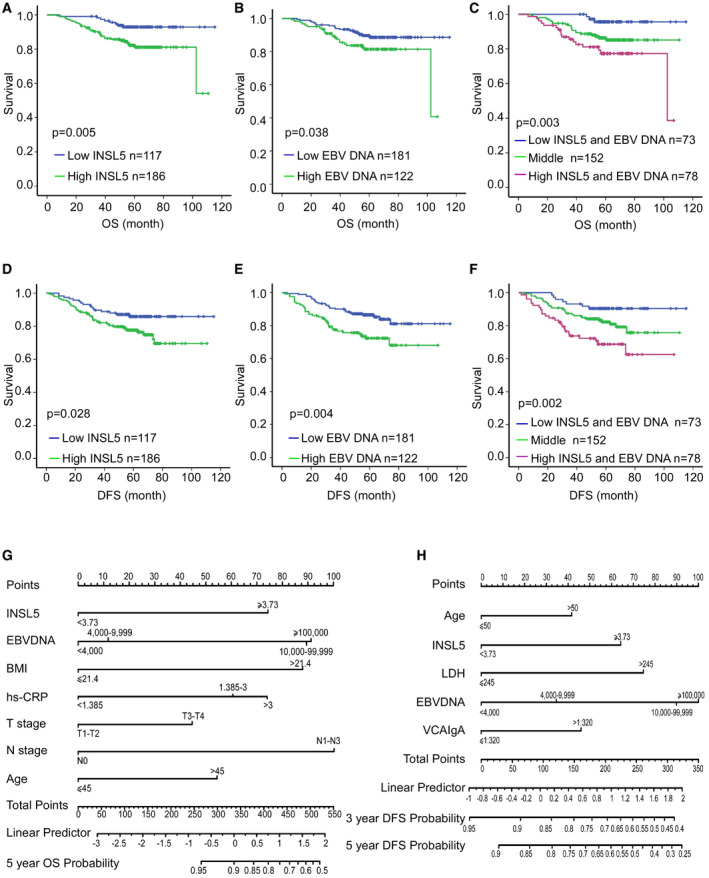
Kaplan–Meier curves showing the overall survival (OS) curves of NPC patients with low or high INSL5 concentration (A), low (≤ 4,000 copy/ml), or high (> 4,000 copy/ml) EBV DNA copy number (B), and the combination of INSL5 concentration with EBV DNA copy number (C).
-
D–F
Kaplan–Meier curves showing the disease‐free survival (DFS) curves of NPC patients with low or high INSL5 concentration (D), low or high EBV DNA copy number (E), and the combination of INSL5 concentration with EBV DNA copy number (F).
-
G
Nomogram, including plasma INSL5 level, plasma EBV DNA, body mass index (BMI), pretreatment hs‐CRP, T stage, N stage, and age for 5‐year overall survival (OS) in patients with nasopharyngeal carcinoma.
-
H
Nomogram, including age, plasma INSL5 level, serum lactate dehydrogenase level, plasma EBV DNA, and VCA‐IgA titer, for three‐ and 5‐year disease‐free survival (DFS) in patients with nasopharyngeal carcinoma.
= 303.

