-
A
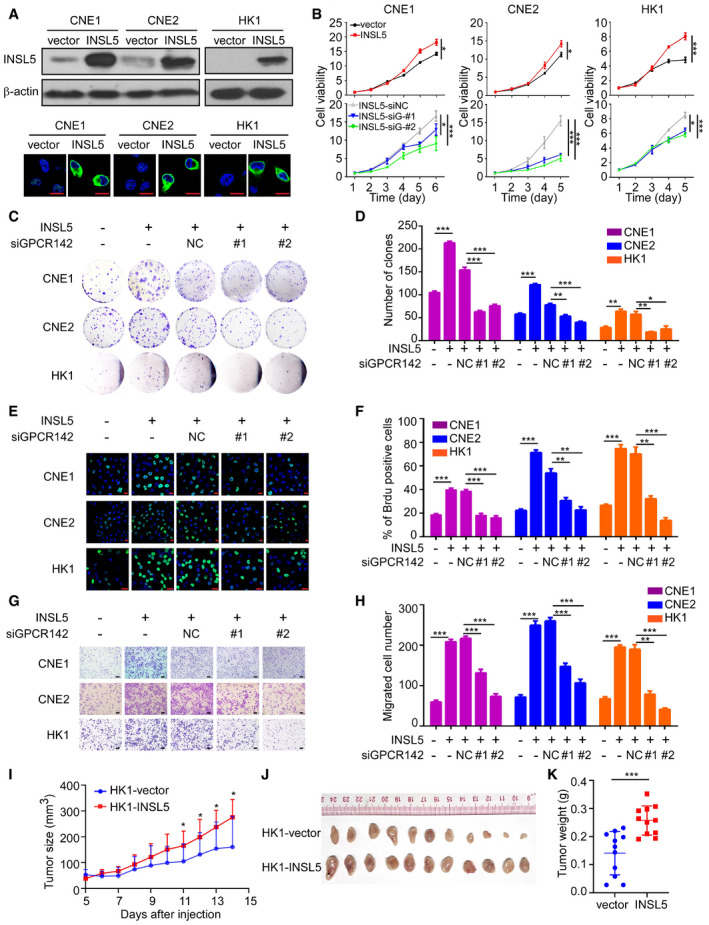
Exogenous expression of INSL5 in NPC cells. Representative immunoblotting (upper panel) and immunofluorescent staining (lower panel) showed stable exogenous expression of INSL5 in both CNE1, CNE2, and HK1 NPC cell lines. Scale bars represent 20 μm.
-
B
MTT assay of vector control or INSL5 overexpressing CNE1, CNE2, and HK1 NPC cell lines (upper panel) either transfected with control siRNA (NC) or GPCR142 siRNA (#1 and #2) (lower panel). n = 4 biological replicates for CNE1 and CNE2 cell line, n = 6 biological replicates for HK1.
-
C–H
Colony formation (C and D), Brdu incorporation (E and F), and migration assays (G and H) of vector control or INSL5 overexpressing CNE1, CNE2, and HK1 NPC cell lines either transfected with control siRNA (NC) or GPCR142 siRNA (#1 and #2). Representative images are shown in (C), (E), and (G) for colony formation, Brdu incorporation, and migration assays, respectively. Number of colonies, the percentage of Brdu positive cells, and migrated cells per field of view were plotted in (D, F, and H), respectively. The results are from three different experiments. Scale bars represent 20 μm in (E) and 100 μm in (G)
-
I, J
Xenograft tumor growth of INSL5 overexpression NPC HK1 stable cell lines in nude mice. Tumor size (I) and tumor weight (J) of two groups. n = 11 mice per group.
Data information: In (B, I, and J), data are presented as mean ± SD, in (D, F, and H), data are presented as mean ± SEM, from three different experiments, and
P‐values were determined by unpaired
t‐test. *
P <
0.05, **
P <
0.01, ***
P <
0.001, ns, no significance. Exact
P‐values are specified in
Appendix Table S4.
Source data are available online for this figure.

