-
A
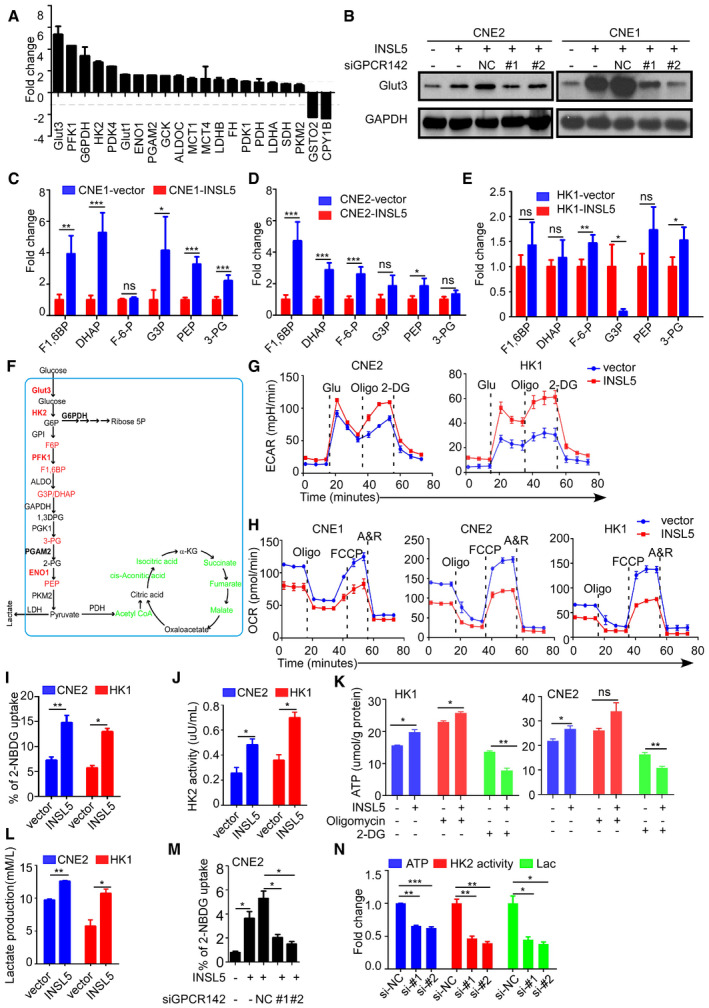
Analysis of glycolytic gene expression by qRT–PCR in INSL5 overexpressed CNE1 cell lines.
-
B
Analysis of glycolytic gene expression by immunoblot in INSL5 overexpressing cells with or without GPCR142 knockdown.
-
C–E
The metabolomics identified increased glycolytic intermediate metabolites in INSL5 overexpressed CNE1 cells (C), CNE2 cells (D), and HK1 cells (E). CNE1 and HK1 were from five independent samples, and CNE2 were from seven independent samples.
-
F
Schematic diagram of aerobic glycolysis pathway and TCA pathway. Red: INSL5 upregulated glycolytic genes and metabolites. Green: INSL5 downregulated TCA intermediates.
-
G
The extracellular acidification rate (ECAR) was measured in cells with or without INSL5 overexpression using a Seahorse XF96 Extracellular Flux analyzer.
-
H
The oxygen consumption rate (OCR) was measured in cells with or without INSL5 overexpression using a Seahorse XF96 Extracellular Flux analyzer.
-
I–L
Glucose uptake (I), HK2 enzyme activity (J), ATP concentration (K), and lactate production (L) in CNE2 and HK1 stable cells.
-
M
Glucose uptake in CNE2 wide‐type or GPCR142 knockdown cells stimulated with INSL5 peptide (50 ng/ml) for 24 h.
-
N
ATP concentration, HK2 enzyme activity, and lactate production in INSL5 wide‐type or knockdown CNE2‐EBV cells.
Data information: In (G–I, M and N), data are presented as mean ± SEM, in (C–E and J–L), data are presented as mean ± SD, from three different experiments, and
P‐values were determined by unpaired t‐test. *
P <
0.05, **
P <
0.01, ***
P <
0.001, ns, no significance. Exact
P‐values are specified in
Appendix Table S4.
Source data are available online for this figure.

