-
A
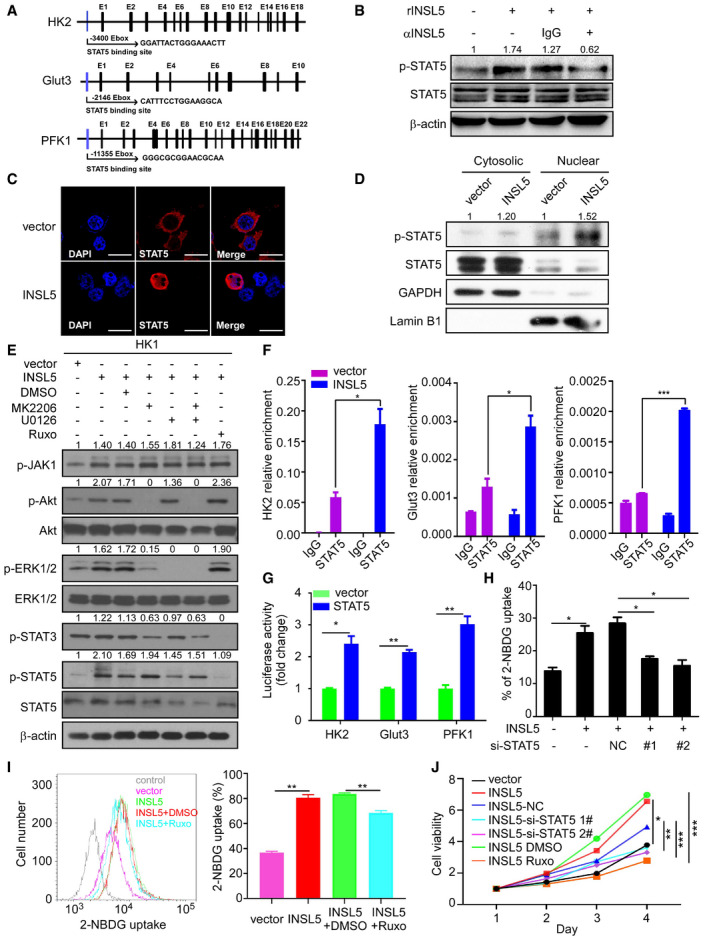
Schematic diagram of the mRNA structures of the glycolytic genes and the indicated STAT5 binding site.
-
B
Phosphorylation of STAT5 under INSL5 stimulation. CNE1 cells were starved in FBS‐free medium for 24 h and then treated with INSL5 peptide (50 ng/ml) in the presence of an anti‐INSL5 antibody at 100 μg/ml, or an isotype‐matched IgG control (IgG) for 30 min.
-
C
Localization of STAT5. A confocal analysis of STAT5 staining was performed using CNE1 cells transfected vector or INSL5. Scale bars represent 20 μm.
-
D
Cytoplasmic and nuclear proteins from vector or INSL5 overexpressing cells were separated and subjected to immunoblot as indicated. The nuclear marker Lamin B1 and the cytoplasmic marker GAPDH were used to demonstrate the purity of fractions.
-
E
INSL5 overexpression activated AKT, ERK, JAK1, and STAT5 phosphorylation, not STAT3 in HK1 cells. INSL5 overexpressing HK1 cells were treated with MK2206 (50 μM), U0126(20 μM), MK2206 + U0126, or Ruxolitinib (5 μM) for 24 h. Western blotting was performed to evaluate the effects of those inhibitors on STAT5 and STAT3 phosphorylation level.
-
F
ChIP‐qPCR analyzed the occupancy of potential E‐boxes by STAT5 in the genes of HK2, Glut3 and PFK1 in INSL5‐overexpressing CNE1 cells using IgG or anti‐STAT5 antibodies.
-
G
Luciferase activity of different glycolytic gene promoter reporters in 293T cells transfected with STAT5 or empty vector.
-
H
Glucose uptake assessed by 2‐NBDG incubation in INSL5 overexpressed CNE1 cells with STAT5 knockdown.
-
I
Glucose uptake was assessed by 2‐BNDG incubation in INSL5 overexpressed HK1 cells treated with JAK kinase inhibitor (Ruxolitinib).
-
J
MTT assay of vector control or INSL5 overexpressing HK1 cells either treated with STAT5 siRNAs or JAK kinase inhibitor.
Data information: In (F–H and J), data are presented as mean ± SEM, in (I), data are presented as mean ± SD, from three different experiments, and
P‐values were determined by unpaired
t‐test. *
P <
0.05, **
P <
0.01, ***
P <
0.001, ns, no significance. Exact
P‐values are specified in
Appendix Table S4.
Source data are available online for this figure.

