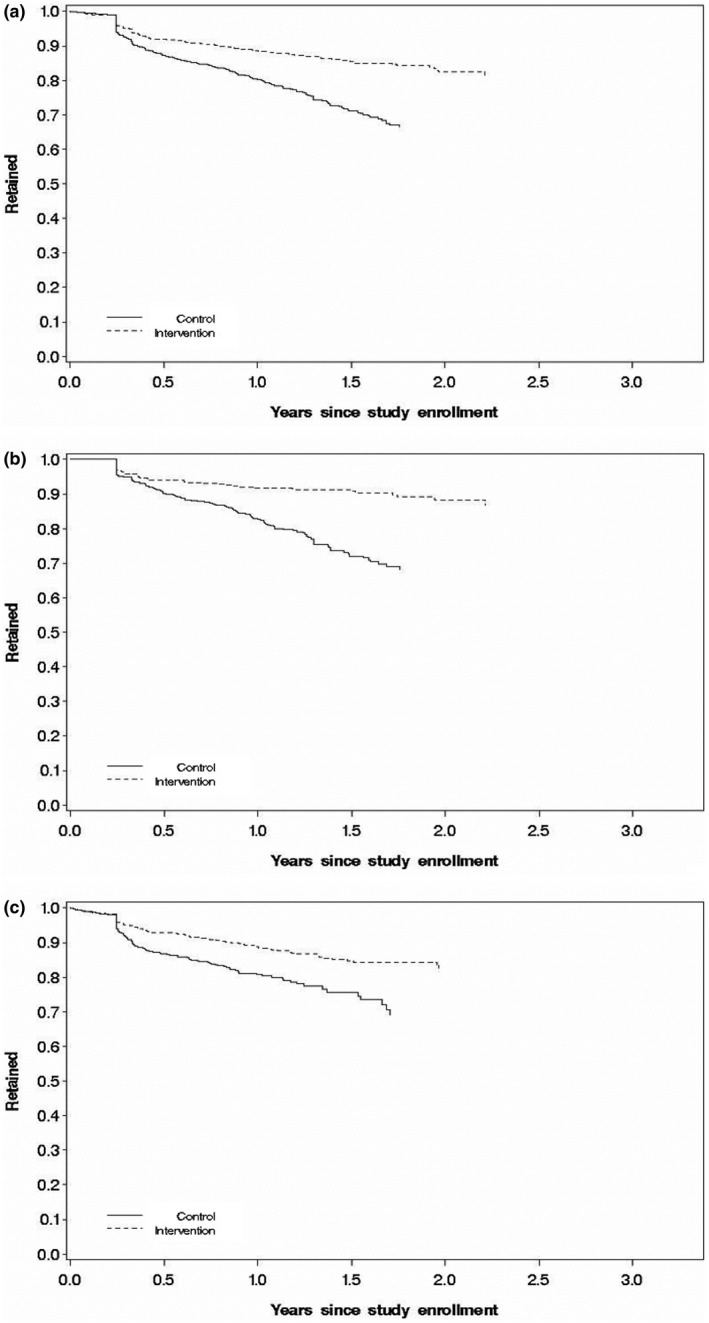
Figure 3.

Kaplan–Meier curves for retention. (a) all participants, (b) above SoC and (c) under SoC. Graphs reflect the cumulative incidence averaged over covariates. Full multivariable model adjusted for steptime, age (18‐<20 years old, 20‐<30 years old, 30‐<40 years old, 40‐<50 years old,5 0‐<60 year old, 60 + years old), sex, marital status (Married, Divorced/Widowed, Single), education (Illiterate/Primary, Secondary, High School, Tertiary), CD4 (<350, 350 to 500, >500), WHO stage (stage 1, stage 2, stage 3 or 4), BMI (<18.5, 18.5‐<25, 25 to <30, ≥30), screened for TB symptoms (yes, no), viral load (<5‚000, 5‚000 to 30‚000, >30‚000), access to HIV treatment supporter (yes, no), level of clinic (Hospital, Clinic with maternity, Clinic without maternity), time from HIV tested positive to enrolment (≤1 year, 1‐ ≤3 years, >3 years), clinic volume (Low: < median, High: ≥ median). Missing data were treated as a separate group for each of the covariates in the models. All adjusted variables were derived at study enrolment. Marginal model was used to adjust for clustering effect among facilities. SoC‐ineligible also included an additional variable for study enrolment date (continuous) in the model
