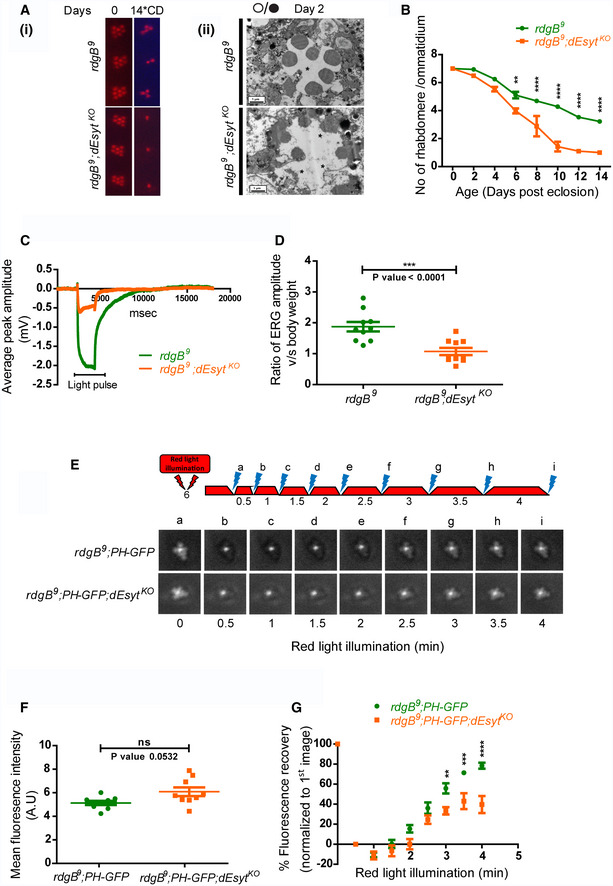
(i) Representative optical neutralization (ON) images showing rhabdomere structure of the indicated genotypes. Rearing conditions and the age of the flies are indicated on top (*CD‐constant dark). (ii) TEM images showing a single ommatidium from the photoreceptors of rdgB
9 and rdgB
9
;dEsyt
KO mutants reared in 12‐h L/D cycle for 2 days. Scale bar: 1 μm (asterisk indicates degenerated rhabdomere).
Quantification of the time course taken for retinal degeneration. 10 ommatidia were scored from 5 flies of each genotype and plotted.
Representative ERG traces showing the duration of light pulse, X‐axis indicates time in msec, and Y‐axis indicates the average ERG amplitude in mV.
Graph showing ERG amplitude of rdgB
9 and rdgB
9
;dEsyt
KO normalized to body weight. Y‐axis shows the ratio of ERG amplitude of individual flies to their body weight. X‐axis indicates genotypes. Each data point represents an individual fly tested. Error bar represents s.e.m.
Deep pseudopupil imaging of PIP2 levels in the microvillar membrane of photoreceptors. The fluorescence of the PH‐GFP probe is depicted. The protocol used is shown with red light illumination periods shown as red bars and flashes of blue light (a–f) used for image capture depicted. Representative deep pseudopupil images acquired at specified time points are depicted. Genotypes as indicated.
Quantification of the mean fluorescence intensity of the PIP2 probe PH‐GFP from the deep pseudopupil formed by one-day‐old flies of the indicated genotypes (n = 10 biological replicates).
Graph quantifying the recovery kinetics of the fluorescent pseudopupil with time, X‐axis represents the genotypes, and Y‐axis represents intensity normalized to the intensity of the first image (n = 10 biological replicates).
Data information: Scatter plots and XY plots with mean ± SD are shown. Statistical tests: (D and F) Student's unpaired
‐test. (B and G) Two‐way ANOVA grouped analysis with Bonferroni post‐tests to compare replicate means. ns—Not significant; **
< 0.0001.

