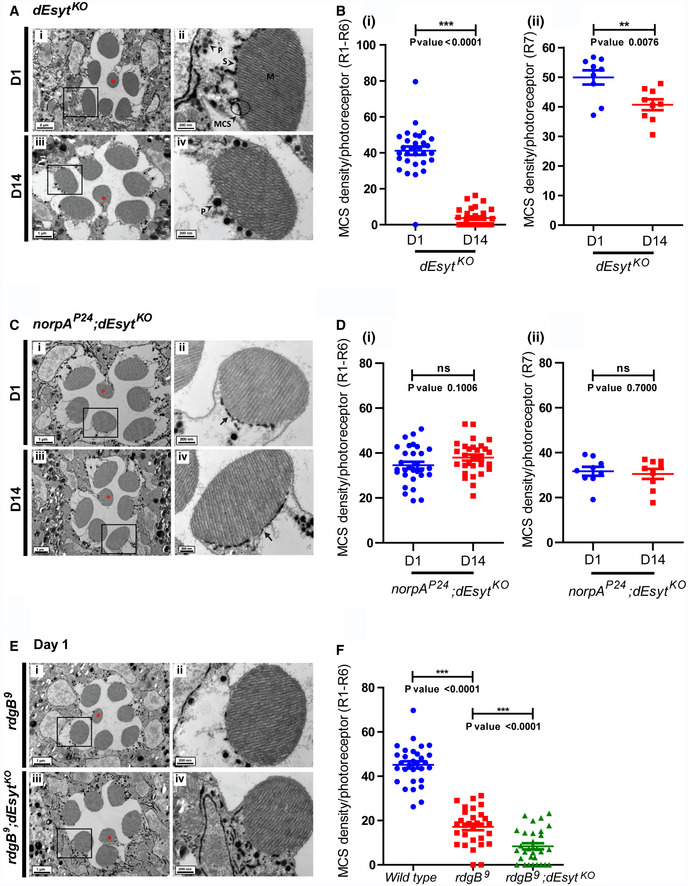
TEM images of a single ommatidium from photoreceptors of (i) dEsyt
KO‐day 1 (iii) dEsyt
KO‐day 14 flies reared in dark, scale bar: 1 μm except for (Ai): 2 μm (red asterisk indicates R7 photoreceptor). (A‐ii, iv) Magnified image showing a single photoreceptor from the ommatidium image shown on the left. Scale bar: 200 nm. Boxes represent the origin boxes for magnification. M—microvillar plasma membrane, S—sub‐microvillar cisternae, MCS—membrane contact site, P—pigment granules.
Quantification of the number of MCS per photoreceptor, X‐axis indicates the genotype and age of the flies and Y‐axis indicates the number of MCS/photoreceptor. n = 9 photoreceptors from 3 separate flies for R7.
TEM images of a single ommatidium from photoreceptors of (i) norpA
P24
;dEsyt
KO‐day 1 (iii) norpA
P24
;dEsyt
KO‐day 14 flies reared in dark, scale bar: 1 μm (red asterisk indicates R7 photoreceptor). (C‐ii, iv) Magnified image showing a single photoreceptor from the ommatidium image shown on the left. Scale bar: 200 nm. Arrows indicate the SMC forming an MCS with the microvillar PM.
Quantification of the number of MCS per photoreceptor, X‐axis indicates the genotype and age of the flies and Y‐axis indicates the number of MCS/photoreceptor. (i) n = 30 photoreceptors from 3 separate flies for R1–R6. (ii) n = 9 photoreceptors from 3 separate flies for R7.
TEM images of a single ommatidium from photoreceptors of (i) rdgB
9‐day 1 and (iii) rdgB
9
;dEsyt
KO‐day 1 flies reared in dark, scale bar: 1 μm (red asterisk indicates R7 photoreceptor). (E‐ii, iv) Magnified image showing a single photoreceptor from the ommatidium image shown on the left. Scale bar: 200 nm.
Quantification of the number of MCS per photoreceptor for R1‐R6 in 1-day‐old dark‐reared wild‐type (from Fig
5B i),
rdgB
9 and
rdgB
9
;dEsyt
KO flies.
n = 30 photoreceptors from 3 separate flies.
Data information: Scatter plots with mean ± SD are shown. Statistical tests: (B and D) Student's unpaired
‐test. (F) One‐way ANOVA with post hoc Tukey's multiple pairwise comparison. Ns—not significant, **
< 0.001.

