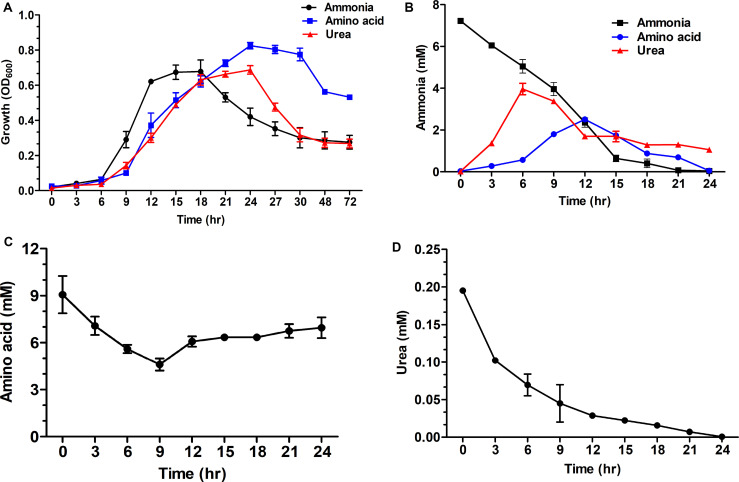
FIGURE 6.
Time course measurements of the effect of nitrogen sources on growth of S. dextrinosolvens Z6. Data points represent averages for triplicate cultures. Error bars represent standard deviations. (A) Growth. (B) Ammonia utilization and production. (C) Amino acid utilization. (D) Urea utilization.

