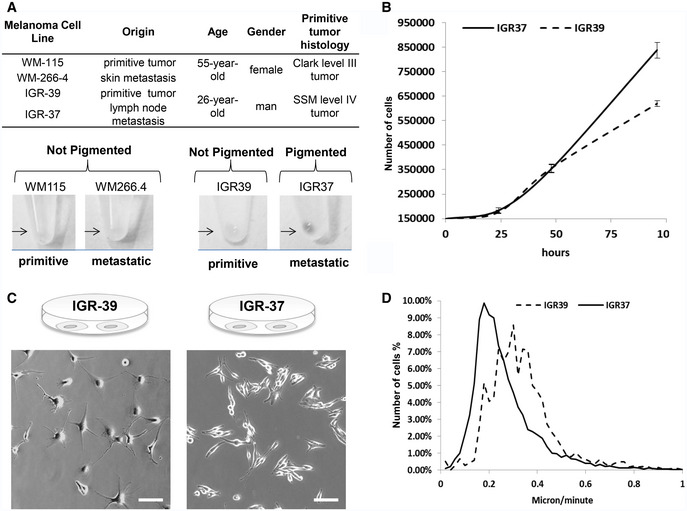
Figure 1. Analysis of a cellular system for primitive and metastatic melanoma.

-
ACharacteristics of IGR39/IGR37 and WM115/WM266.4 melanoma cell lines (Upper Panel). Pigmentation of melanoma cells pellets (lower panel).
-
BGrowth curve of primitive IGR39 and metastatic IGR37 cell line (N = 3 biological replicates). Data are mean ± SD.
-
CPhase‐contrast images of IGR39 and IGR37 cells. Scale bar is 100 μm.
-
DAnalysis of IGR39 and IGR37 speed of migration by time‐lapse microscopy.
