
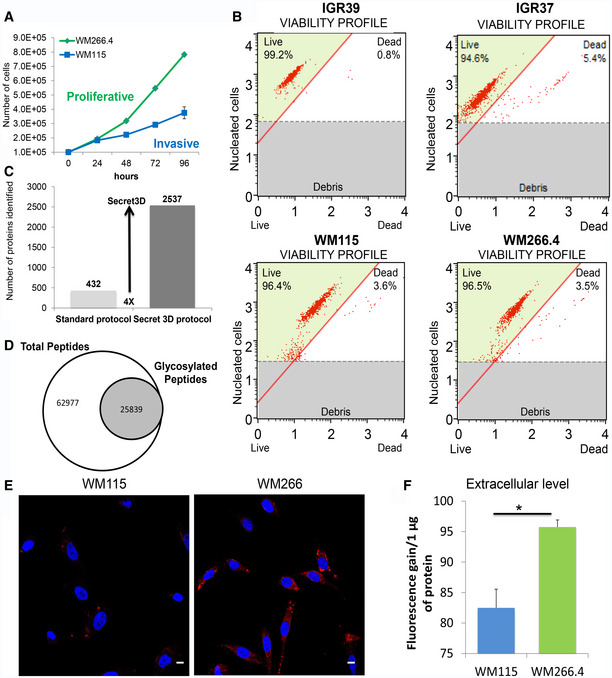
Figure EV1. (Related to Figs 1 and 2) Analysis of a model system for primitive and metastatic melanoma, Secret3D and Proteostat analysis.
-
AGrowth curve of primitive WM115 and metastatic WM266.4 cell line (N = 3 biological replicates) measured as number of cells/time.
-
BViability profile of IGR and WM cell lines after 24‐h starvation, detected by measuring cell confluence (%) and number of dead and alive cells using Muse™ Cell Analyzer.
-
CNumber of proteins identified in the secretome by Secret3D compared to a standard protocol.
-
DNumber of total and glycosylated peptides identified by Secret3D.
-
EConfocal immunofluorescence images of Proteostat (1:2,000, red spots) and DAPI staining (blue) for WM115 and WM266.4 cells. Scale bar is 10 μm.
-
FQuantitation of aggregates in the extracellular space in WMs. Fluorescence gain of proteins present in the supernatant treated with Proteostat reagent. (T‐test, *P < 0.05) N = 4 biological replicates. Data are mean ± SD.