-
A
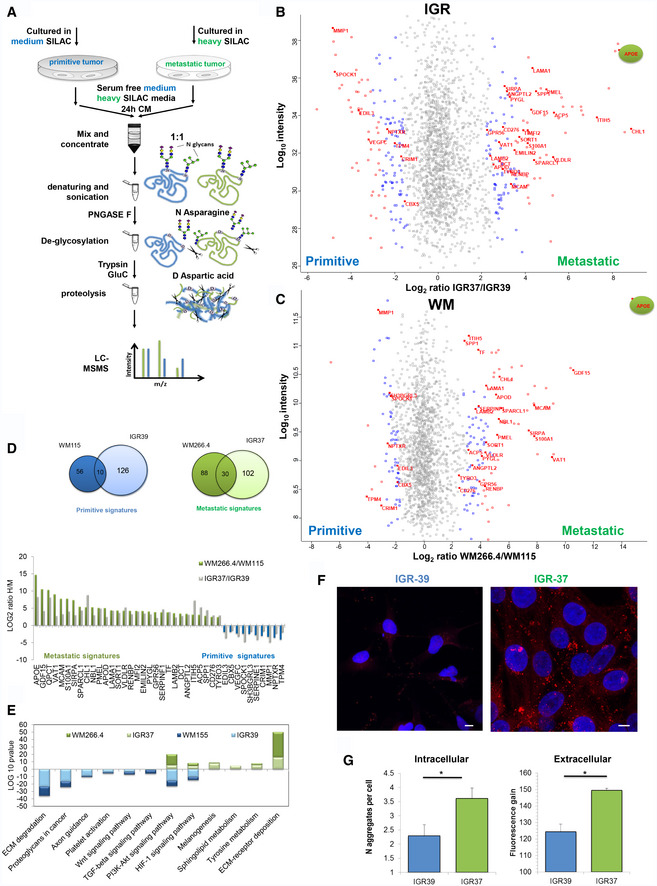
MS workflow of Secret3D: Secretome De‐glycosylation Double Digestion protocol.
-
B
Scatter plot of identified and quantified proteins in the secretome of primitive IGR39 and metastatic IGR37. Red dots represent proteins that were significant with FDR < 0.05, and blue dots represent proteins with P < 0.05.
-
C
Scatter plot of identified and quantified proteins in the secretome of primitive WM115 and metastatic WM266.4. Red dots represent proteins that were significant with FDR < 0.05, and blue dots represent proteins with P < 0.05.
-
D
(Left) Venn diagram of the significant proteins shared by both IGR and WM cell lines. (Right) Histograms representing the metastatic and primitive signatures H/M ratios.
-
E
KEGG pathway enrichment analysis of the significant proteins.
-
F
Confocal fluorescence images of Proteostat (1:2,000, red spots) and DAPI staining (blue), scale bar is 10 μm.
-
G
Quantitation of aggregates/cell in IGRs cell lines by immunofluorescence analysis, left panel; fluorescence gain of soluble proteins treated with Proteostat reagent, right panel. (T‐test analysis, *P < 0.05, N = 3 biological replicates, data are mean ± SD).

