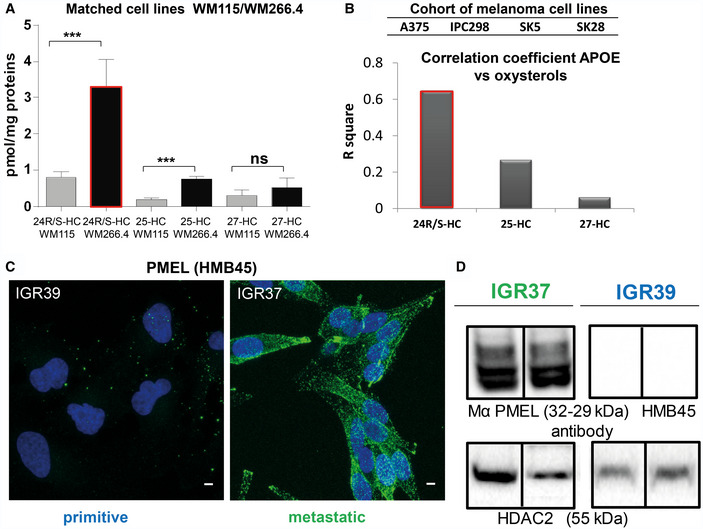
Figure 3. Oxysterol quantification in primitive and metastatic melanoma cells and PMEL expression in IGR37 and IGR39 melanoma cell line.

-
AAbsolute quantitation of 24‐, 25‐ and 27‐hydroxycholesterol in primitive and metastatic melanoma cells as indicated. (T‐test analysis, ***P < 0.001, N = 3 biological replicates, data are mean ± SD).
-
BHistogram representing R square of correlation analysis between absolute quantitation of 24‐, 25‐ and 27‐hydroxycholesterol and label free quantitation of APOE in a cohort of primitive (A375, IPC298) and metastatic (SKMEL5, SKMEL28) melanoma cell lines.
-
CConfocal fluorescence images of anti‐HMB45 PMEL antibody signal (green) and DAPI staining (blue) in IGR37 and IGR39. Scale bar is 10 μm.
-
DWestern blot on IGR37 and 39 cellular lysates probed with anti‐HMB45 PMEL antibody and anti HDAC2 to check the loading of similar amount of total lysates.
Source data are available online for this figure.
