-
A
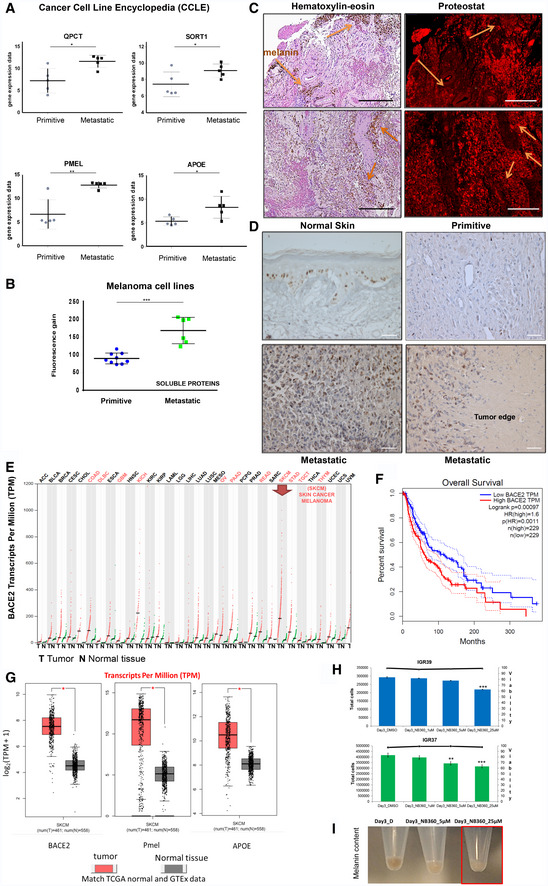
Gene expression data from the Cancer Cell Line Encyclopedia (CCLE). Gene expression level for the selected genes was searched in the same melanoma cell lines used for proteomic analysis. Primitive melanoma cell lines were WM115, IGR39, A375, C32, and IPC298, while metastatic melanoma cell lines were WM266.4, IGR37, SKMEL5, SKMEL28, and MEWO. T‐test, *P < 0.05, **P < 0.001. Data are expressed as mean ± SD.
-
B
Analysis of protein aggregates present in the secretome of 10 different melanoma cell lines. Fluorescence gain of proteins present in the supernatant treated with Proteostat reagent is reported. T‐test analysis, ***P < 0.001. Data are mean ± SD.
-
C
Mosaic acquisition of melanoma metastases in human brain stained with hematoxylin–eosin or with Proteostat. The arrows point at melanin signals. Scale bar is 300 μm.
-
D
KI‐67 staining (brown) in healthy tissue, primitive melanoma and metastatic melanoma as indicated. Scale bar is 50 μm.
-
E
BACE2 expression profiling by cancer type in TCGA normal and GTEx dataset by using GEPIA software (
http://gepia.cancer-pku.cn/). The gene expression profile across all tumor samples (red dots) and paired normal tissues (green dots). Each dot represents expression of samples.
-
F
Overall survival analyses performed using the GEPIA online platform for melanoma dataset. The solid line represents the survival curve, and the dotted line represents the 95% confidence interval. Log‐rank P < 0.05 was considered to indicate a statistically significant difference. Patients with expression above the median are indicated by red lines, and patients with expression below the median are indicated by blue lines. BACE2 expression level (Transcript Per Million, TPM) is negatively associated with the overall survival of melanoma patients.
-
G
Gene expression level (Transcript Per Million, TPM) in cancer/normal tissue for the selected genes extracted from TCGA normal and GTEx data in melanoma dataset contained in GEPIA software. T‐test: *P < 0.05.
-
H
Cell viability of IGR cell lines treated with NB‐360 at different concentrations and time of incubation as reported. N = 3, T‐test analysis. **P < 0.01; ***P < 0.001. The histogram represents total cell number. The horizontal line represents % of alive cells.
-
I
Pigmentation of IGR37 upon incubation with NB‐360. Red box shows depigmentation after NB‐360 administration.

