
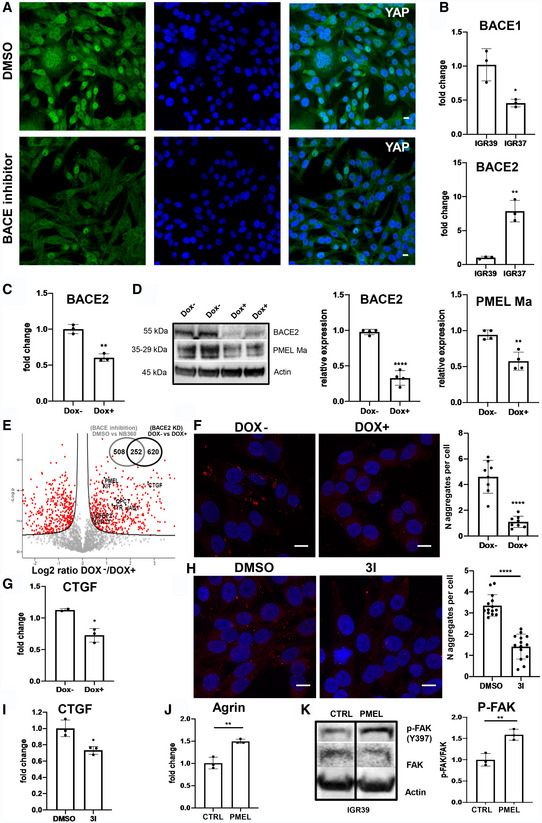
Figure EV4. (Related to Fig 5) Effect of BACE1/2 inhibition and BACE2 KD in IGR37 metastatic melanoma cells and of PMEL administration in IGR39 primitive cells.
-
AConfocal fluorescence images of anti‐YAP antibody (green) and DAPI staining (blue) in IGR37 upon treatment with DMSO or BACE1/2 inhibitor. Scale bar is 10 μm.
-
BBACE1 and BACE2 mRNA levels measured by real‐time PCR in IGR37 and IGR39. N = 3 biological replicates. T‐test, *P < 0.05, **P < 0.001. Data are mean ± SD.
-
CBACE2 mRNA levels measured by real‐time PCR in iBACE2 KD IGR37 treated or not with doxycycline. N = 4 biological replicates. T‐test analysis, **P < 0.001. Data are mean ± SD.
-
DWestern blot and densitometric analysis of BACE2 and PMEL Ma relative expression in iBACE2 KD IGR37 treated or not with doxycycline. Actin was used as loading control. N = 4 biological replicates. T‐test, **P < 0.01, ****P < 0.0001. Data are mean ± SD.
-
EVolcano plot of the proteins secreted by iBACE2 KD IGR37 cells treated or not with doxycycline (Secret3D workflow). N = 4 biological replicates. Proteins downregulated upon BACE2 silencing are reported in the right part of the plot. Venn diagram of statistically significant proteins common between NB‐360 treatment and BACE KD in IGR37 (right upper corner).
-
FConfocal fluorescence images of Proteostat signal (1:2,000, red) and DAPI staining (blue), scale bar is 10 μm, and quantitation of protein aggregates in iBACE2 KD IGR37 cell lines treated or not with doxycycline by immunofluorescence analysis using Fiji software. N = 8 biological replicates. T‐test, ****P < 0.0001. Data are mean ± SD.
-
GmRNA levels of CTGF measured by real‐time PCR in iBACE2 KD IGR37 treated or not with doxycycline. N = 3 biological replicates. T‐test, *P < 0.05. Data are mean ± SD.
-
HConfocal fluorescence images of Proteostat signal (1:2,000, red) and DAPI staining (blue), scale bar is 10 μm, and quantitation of protein aggregates in IGR cell lines treated or not with 3I inhibitor by immunofluorescence analysis using Fiji software. N = 14 biological replicates. T‐test, ****P < 0.0001. Data are mean ± SD.
-
ImRNA levels of CTGF measured by real‐time PCR in IGR37 treated or not with 3I inhibitor. N = 3 biological replicates. T‐test analysis, *P < 0.05. Data are mean ± SD.
-
JmRNA levels of Agrin measured by real‐time PCR in IGR39 treated with recombinant PMEL. N = 3 biological replicates. T‐test, **P < 0.01. Data are mean ± SD.
-
KWestern blot and densitometric analysis of pFAK(Y397) in IGR39 treated with recombinant PMEL. Actin was used as loading control. N = 3 biological replicates. T‐test, **P < 0.01. Data are mean ± SD.
Source data are available online for this figure.