-
A
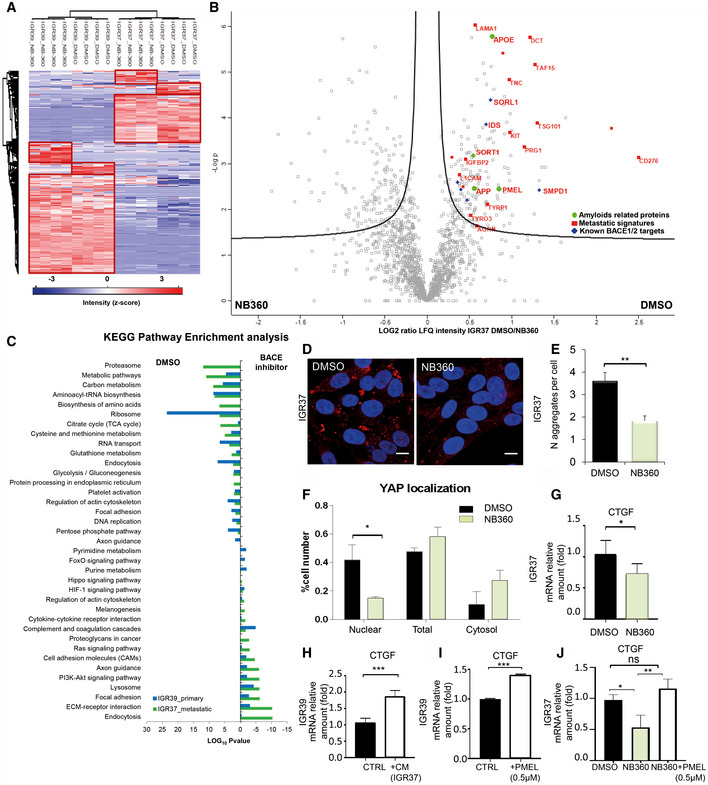
Unsupervised hierarchical clustering of the proteins identified and quantified in IGR37 and IGR39 upon treatment with DMSO or NB‐360.
-
B
Volcano plot of the proteins secreted by IGR37 cells treated with DMSO or NB‐360.
-
C
KEGG enrichment pathway analysis of the significantly regulated proteins upon BACE inhibition in both IGRs.
-
D
Confocal fluorescence images of Proteostat signal (1:2,000, red spots) and DAPI staining (blue), scale bar is 10 μm.
-
E
Quantitation of protein aggregates in IGRs by immunofluorescence analysis using Fiji software. (T‐test analysis, **P < 0.01, N = 3 biological replicates, data are mean ± SD).
-
F
Quantitation, by immunofluorescence analysis, of YAP in different cellular compartments (T‐test analysis, *P < 0.05, N = 3 biological replicates, data are mean ± SD). Images were quantified by subdividing cells into mostly cytosolic YAP (Cytosol), mostly nuclear YAP (Nuclear), or equal distribution (Total) from three biological replicates.
-
G
mRNA levels of CTGF measured by real‐time PCR in IGR37 treated with DMSO or NB‐360 (T‐test analysis, *P < 0.05, N = 3 biological replicates, data are mean ± SD).
-
H
CTGF mRNA level measured by real‐time PCR in IGR39 treated with IGR39 conditioned medium (CTRL) or with IGR37 conditioned medium (CM), N = 4 biological replicates. T‐test analysis, ***P < 0.001, data are mean ± SD.
-
I
CTGF mRNA level measured by real‐time PCR in IGR39 supplemented with recombinant PMEL amyloid fibrils (0.5 μM), N = 3 biological replicates. T‐test analysis: ***P < 0.001, data are mean ± SD.
-
J
CTGF mRNA level measured by real‐time PCR in IGR37 treated with DMSO, NB‐360 or NB‐360 plus recombinant PMEL amyloid fibrils (0.5 μM), N = 3 biological replicates. T‐test analysis *P < 0.05, **P < 0.01. Data are mean ± SD.

