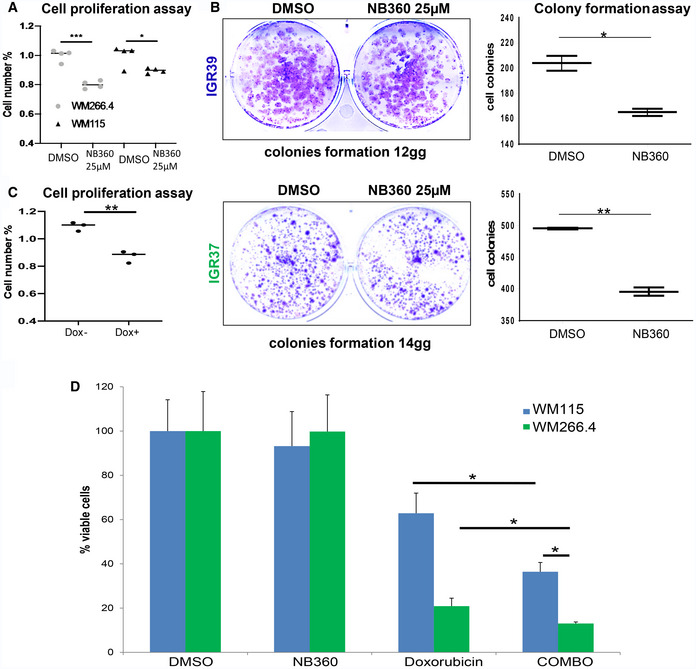
Figure EV5. (Related to Fig 6) Effect of BACE inhibition and BACE2 KD on colony formation, cell proliferation, and chemo‐sensitivity.

-
AMTT assay for WMs treated with DMSO or NB‐360 (25 μM). N = 4 biological replicates. T‐test analysis, *P < 0.05, ***P < 0.001. Data are mean ± SD.
-
BColony formation assay and relative quantitation on the right panels, for IGR39 and IGR37 cells treated with DMSO or NB‐360. N = 3 biological replicates. T‐test analysis, *P < 0.05, **P < 0.01. Data are mean ± SD.
-
CMTT assay of iBACE2 KD IGR37 cells treated or not with doxycycline. N = 3 biological replicates. T‐test analysis, **P < 0.01. Data are mean ± SD.
-
DViability of WM melanoma cell lines treated with DMSO, doxorubicin 10 μM, NB‐360 25 μM, and the combination of doxorubicin and NB‐360 measured as % of viable cells. N = 3 biological replicates. T‐test analysis, *P < 0.05. Data are mean ± SD.
