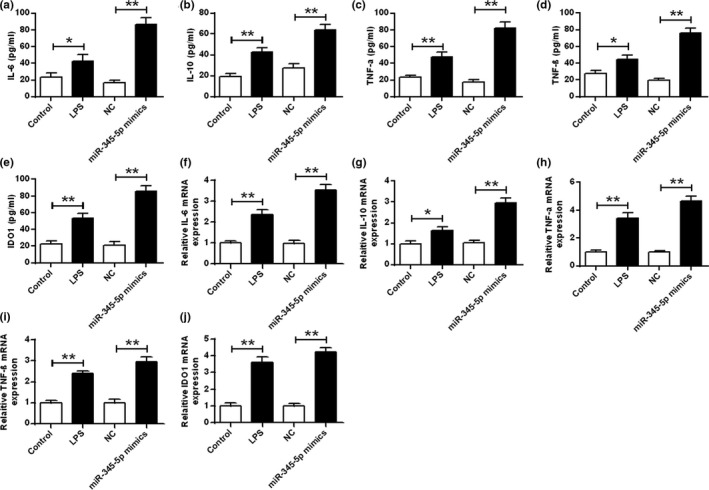
FIGURE 2.

Effect of miR‐345‐5p on the expression levels of pro‐inflammatory cytokines in BV‐2 microglia. (a–e) ELISA was used to measure the expression levels of IL‐6, IL‐10, TNF‐α, TNF‐β, and IDO1 in BV‐2 microglia. (f–j) qRT‐PCR was used to measure the expression levels of IL‐6, IL‐10, TNF‐α, TNF‐β, and IDO1 in BV‐2 microglia. *p < .05, **p < .01
