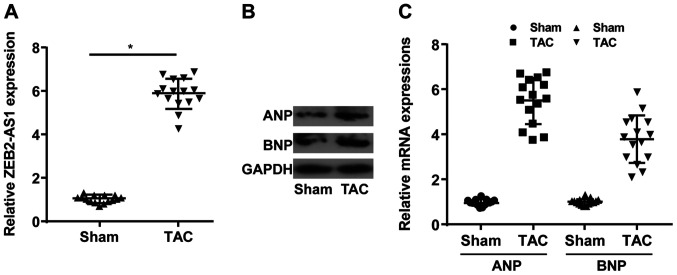
Figure 1.
ZEB2-AS1 upregulation in cardiac hypertrophy model mice. (A) Relative expression level of ZEB2-AS1 in the sham and TAC groups. (B) Protein and (C) mRNA expression levels of ANP and BNP in the sham and TAC groups. ZEB2-AS1, ZEB2 antisense RNA 1; TAC, transverse aortic constriction; ANP, natriuretic peptide A; BNP, brain natriuretic peptide. *P<0.05.

