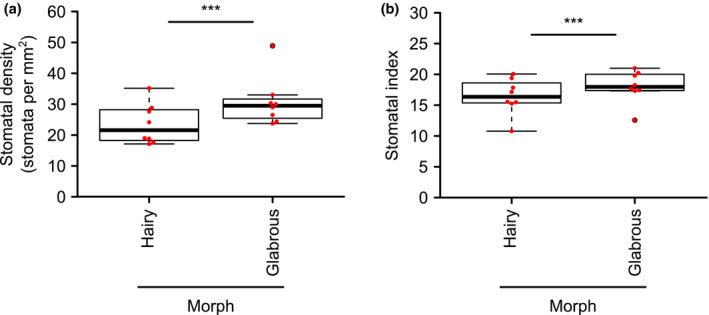
FIGURE 2.

Stomatal density differs between hairy and glabrous morphs within a natural population of Arabidopsis halleri. (a) Stomatal density and (b) stomatal index for fully expanded leaves of hairy and glabrous morphs. Each red point represents the mean stomatal density or stomatal index from one individual plant. The mean stomatal density and stomatal index per plant was derived from two microscopy images analyzed from 3 to 4 leaves of each plant. The center line of the boxplot indicates the median. n = 8 plants from each morph; analyzed by one‐way nested ANOVA. ***Indicates p < .001
