
Figure 3.
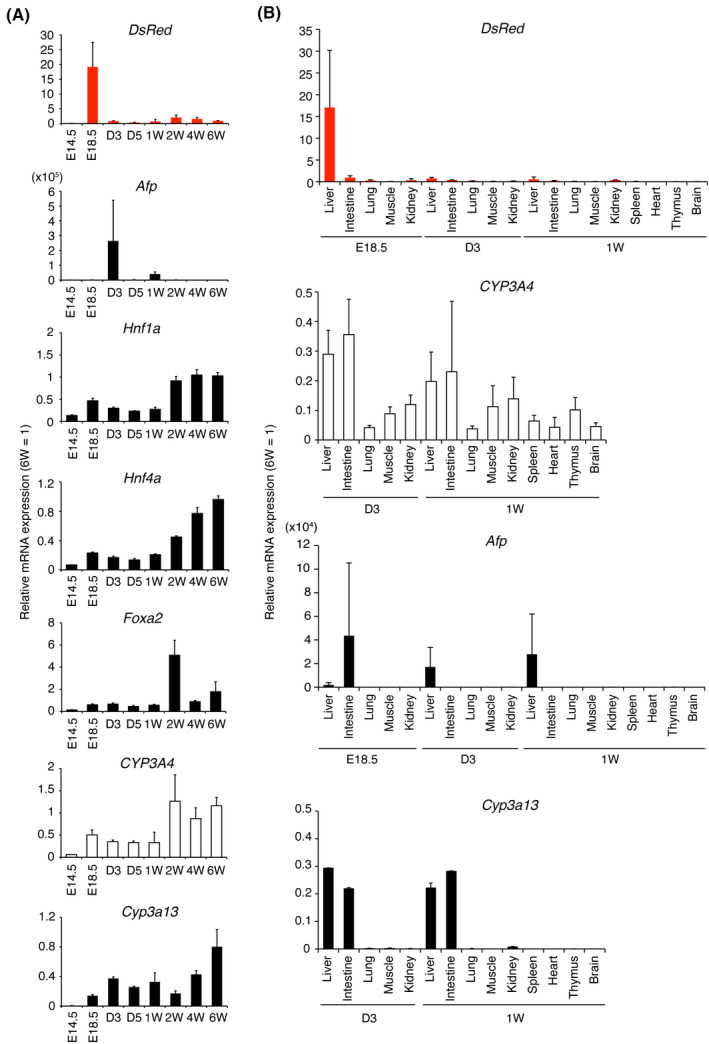
mRNA expression in CYP3A7R mice. A, RT‐qPCR analysis of DsRed and Afp in the perinatal liver and abundantly expressed genes in hepatocytes. Values are normalized to 6W transgenic liver expression levels. B, Tissue‐ and stage‐specific expression (n = 2, duplicate measurements)