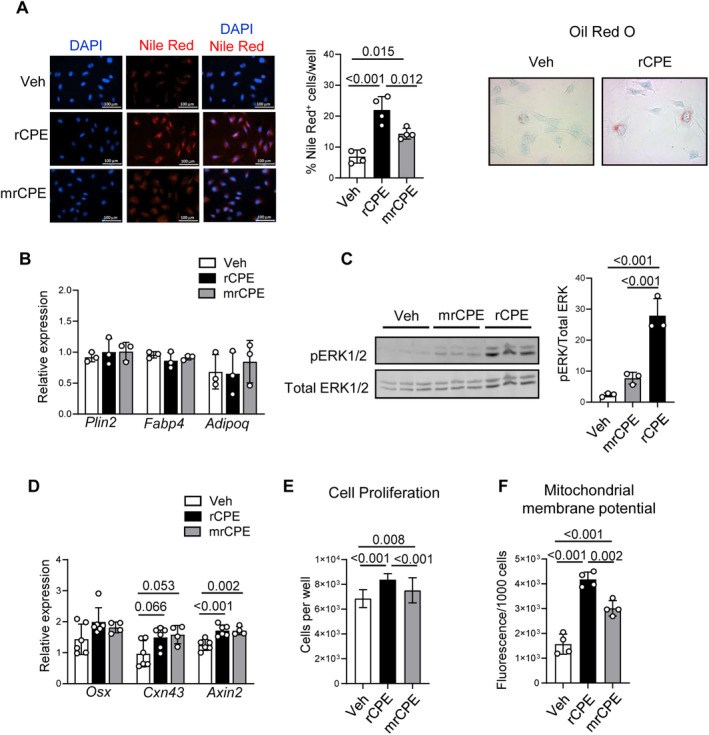
Fig 3.

Effect of treatment with either of nonmutated recombinant carboxypeptidase E (rCPE) or mutated recombinant CPE (mrCPE) on preosteoblastic U33 cells. (A) Perinuclear lipid accumulation after 24‐hour treatment detected with either fluorescent Nile red or oil red O staining, as indicated. Fractions of cells positive for Nile red staining were quantified and presented on the graph. (B) Relative mRNA expression of adipocyte‐specific gene markers after 72‐hour treatment (n = 4 to 6 independent RNA samples per treatment). (C) Phosphorylation of ERK1/2 kinases after 10‐min treatment. Thirty μg of protein lysate was loaded per lane. pERK1/2 and total ERK1/2 were detected as described in the Materials and Methods section. Relative band densities were measured with Image J and measurements representing pERK1/2 were normalized to the density of corresponding total ERK1/2. (D) Relative mRNA expression of osteoblast‐specific gene markers after 72‐hour treatment (n = 4 to 6 independent RNA samples per treatment). (E) The effect of 24‐hour treatment on cell proliferation measured by Cytation 5 (n = 9 to 17 replicas per treatment). (F) The effect of 24‐hour treatment on mitochondrial activity measured as mitochondrial membrane polarization using tetramethylrhodamine ethyl ester perchlorate (TMRE) assay (n = 4 replicas per treatment). White bars = vehicle (Veh); black bars = rCPE; gray bars = mrCPE.
