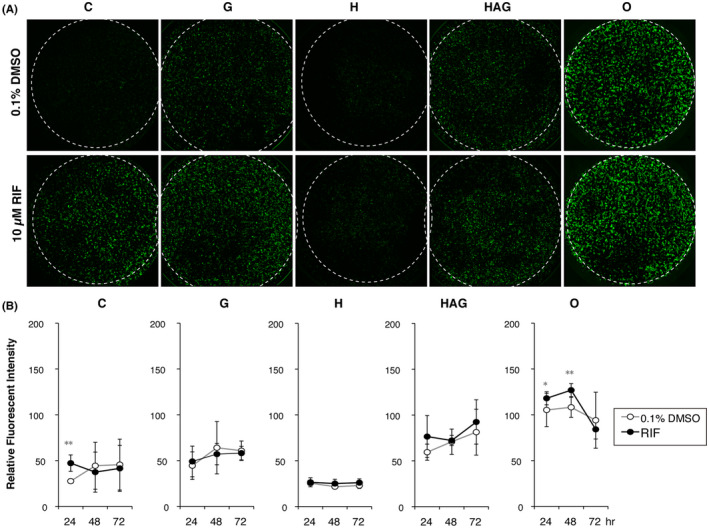
FIGURE 4.

Effect of culture plate type on fluorometric CYP3A4 transcriptional induction tests. A, Images of EGFP‐positive cells were captured on D10 after culturing in medium containing 0.1% DMSO (upper, untreated control) or 10 µmol L−1 rifampicin (RIF) (bottom, treated sample) for 48 hours. B, Semi‐quantitative fluorometric evaluation of EGFP‐positive hepatocyte‐like cells (HLCs). Each value was normalized to the mean value obtained in D9 cells cultured in O plates in the 1.7% DMSO medium as 100 (n = 3). Black circles, cells cultured in medium containing 10 µmol L−1 RIF; open circles, cells cultured in the 0.1% DMSO medium during the last 3 days of the cell culture period
