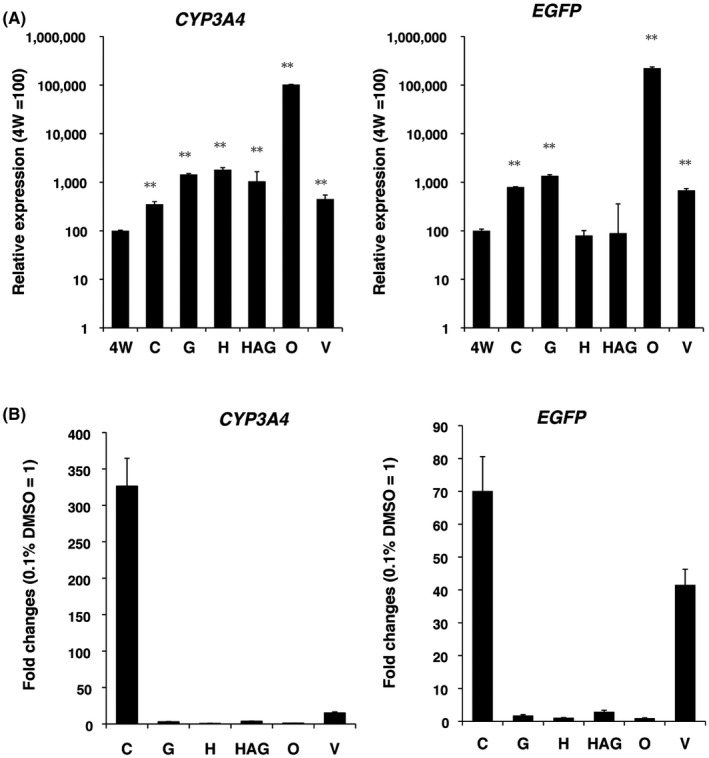
FIGURE 5.

Effect of plate type on CYP3A4 mRNA transcription assessed by RT‐qPCR. A, Enhanced expression of CYP3A4 and EGFP mRNA evaluated by RT‐qPCR (n = 3, triplicate measurements). B, CYP3A4 and EGFP transcriptional induction rates estimated according to mRNA levels. Graphs show the mean ± SD of the fold change with the 0.1% DMSO control considered as 1
