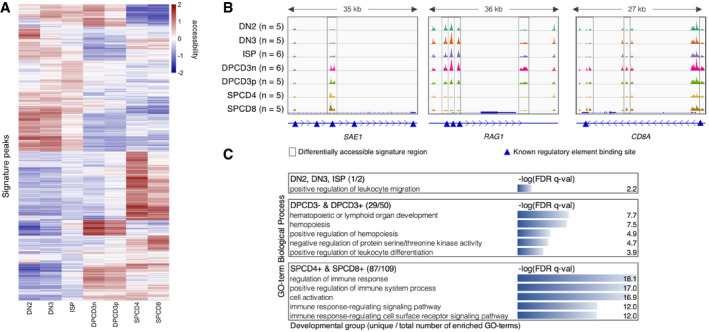
Figure 2. Signature open chromatin regions distinguish T‐cell developmental stages.

-
AUnsupervised hierarchical clustering based on the variance stabilizing transformation (VST) normalized read counts (each row is also normalized by the row mean) of the 2,021 signature open chromatin regions of 7 stages (see Fig EV2 for five stages).
-
BATAC‐Seq genome tracks showing three signature peaks located near the genes SAE1, RAG1, and CD8A. Framed regions indicate cell‐type-specific signature ATAC‐Seq peaks. Blue triangles indicate known promoter or enhancer regions, which are annotated in the GeneHancer (GH) Regulatory Elements database (Fishilevich et al, 2017).
-
CFunctional enrichment analysis of the signature OCRs allocated to three developmental groups by GREAT. Top five unique GO‐terms which have the lowest FDR q‐val are shown. In parenthesis: number of uniquely enriched GO‐terms / total number of enriched GO‐terms.
