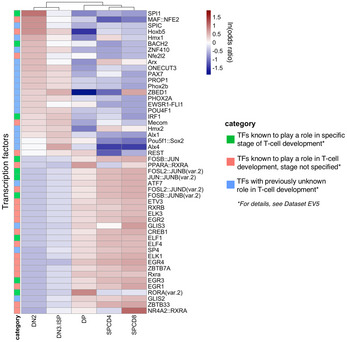
Figure EV3. Global TF motif enrichment analysis performed on the ATAC‐Seq peaks alone.

Heatmap of ln(odds ratio) of the 50 TFs showing the most differential abundance of binding motifs in open chromatin regions. TFs with an SD of the motif counts < 10 are excluded.
