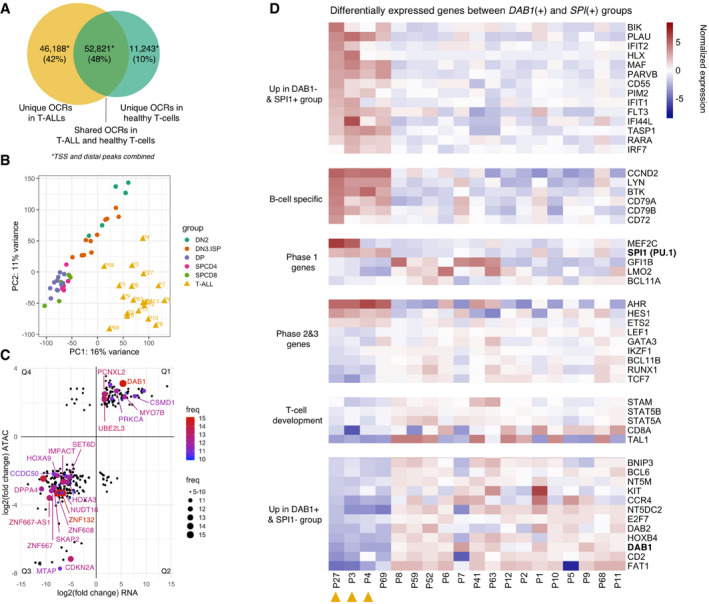
Figure 5. The integration of differential chromatin accessibility and expression analyses reveals recurrently dysregulated genes.

-
ANumber of unique and shared OCRs (TSS and distal) in T‐ALLs and in healthy T‐cell precursors.
-
BUnsupervised learning by PCA of all TSS and distal peaks collected in the combined analysis of healthy and leukemic T cells.
-
CLog2 fold changes of 292 genes which are differentially expressed (x‐axis, RNA‐Seq: non‐sorted bulk thymi vs. T‐ALLs) and differentially accessible (y‐axis, ATAC‐Seq: sorted T‐cell populations vs. T‐ALLs) in T‐ALLs in comparison to healthy T‐cell precursors. Dot size and color indicate the frequency (number of patients having dysregulation of the gene). Genes with ≥ 5/19 frequency are shown on the plot. Protein coding genes with ≥ 12/19 frequency are labeled. For plotting, the average LFC values of ATAC and RNA are used per gene per quartile. Q1–4 stands for the quadrant 1–4.
-
DHeatmap of VST normalized read counts (each row is also normalized by the row mean) of differentially expressed genes (P‐value < 0.1; DESeq2) in three patients in comparison to remaining 16. Orange triangles indicate three patients with no DAB1 but high SPI1 expression and motif counts.
