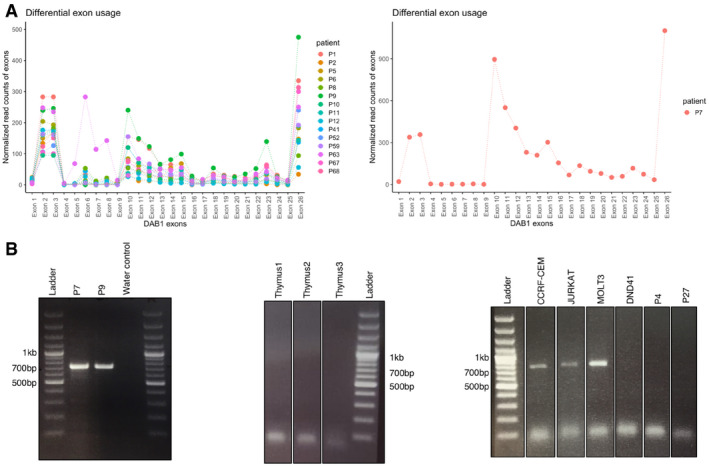
Figure EV5. Differential exon usage analysis of DAB1 .

-
AExpression of DAB1 exons (x‐axis) in DAB1(+) patients. Read counts (y‐axis) are normalized by the coverage. Mean read counts are used for n = 10 patients, whose biological replicates are available. Patient P7, who exhibit the highest expression, is shown separately.
-
BRT–PCR products, spanning exons 10–15 of DAB1, run on the 1.3% agarose gel. DAB1(+) patients P7 and P9, and T‐ALL cell lines CCRF‐CEM, JURKAT and MOLT3 show the expression of unannotated exon. Three bulk thymi, DAB1(−) patients P4 and P27, and cell line DND41, which had as low expression as the DAB1(−) patients as shown by qPCR, do not show the expression.
