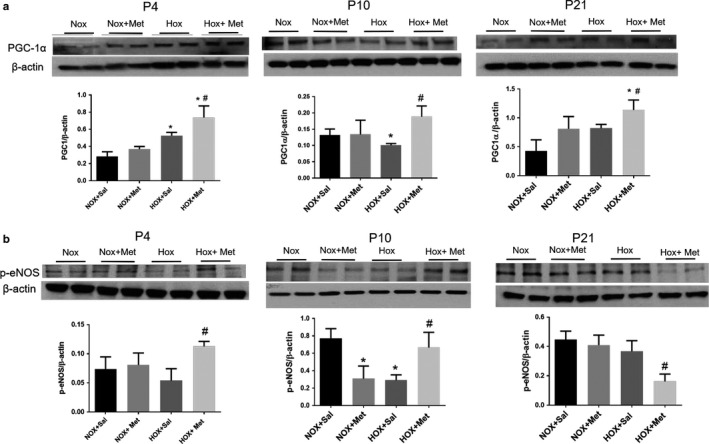
FIGURE 8.

Representative immunoblots and summary data for PGC‐1α (a) and p‐Ser1177eNOS (b) in lung samples from the four groups of rat pups at postnatal day 4 (P4), P10 and P21. Summary data are shown in bar graphs as mean ± SD for n = 4 at P4 and n = 8 at P10 and P21. * Indicates p < .05 by ANOVA and Tukey's post‐hoc test from normoxia + saline and # from hyperoxia + saline groups. Hyperoxia increased the PGC‐1α protein level at P4 and decreased it in P10 lung samples. PGC‐1α protein levels increased in metformin‐treated hyperoxia group at all three ages, P4, P10, and P21. Hyperoxia has decreased the p‐eNOS levels at P10. Metformin increased p‐eNOS levels at P4 and P10 during hyperoxia. The p‐eNOS levels decreased at P21 in metformin‐treated hyperoxia‐exposed pups compared to saline‐treated pups. HOX, hyperoxia; NOX, normoxia
