
FIGURE 9.
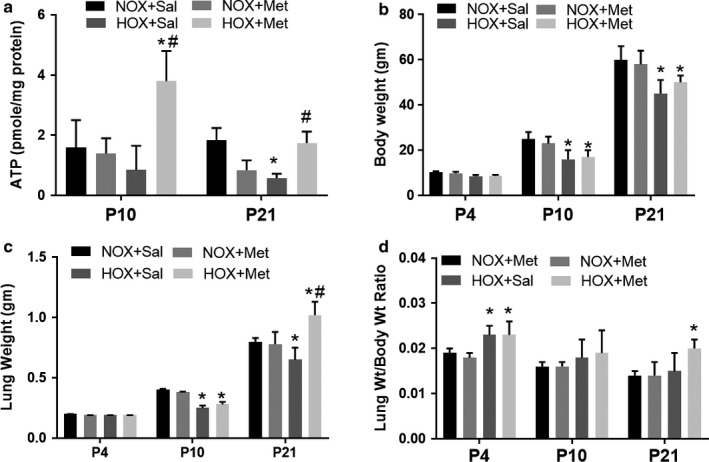
Effect of hyperoxia and metformin on lung ATP levels, body weight, and lung weights in neonatal rat pups. Data are mean ± SD for n = 4 at P4 and n = 8 at P10 and P21. * Indicates p < .05 by ANOVA and Tukey's post‐hoc test from normoxia + saline and # from hyperoxia + saline groups. (a) Hyperoxia decreased the ATP levels significantly at P21 from normoxia + saline group. Metformin treatment of hyperoxia‐exposed pups increased the ATP levels at both P10 and P21. (b) Body weights were not different at P4 but were significantly lower in both hyperoxia‐exposed groups at P10 and P21. (c) Lung weights were significantly lower in hyperoxia + saline group at P10 and P21. Metformin‐treated hyperoxia pups had higher lung weights at P21. (d) Lung weight to body weight ratio was higher at P4 in both hyperoxia‐exposed groups and was not different at P10 or P21 in the hyperoxia + saline group. Lung weight to body weight ratio was higher in metformin‐treated hyperoxia pups at P21. HOX, hyperoxia; NOX, normoxia