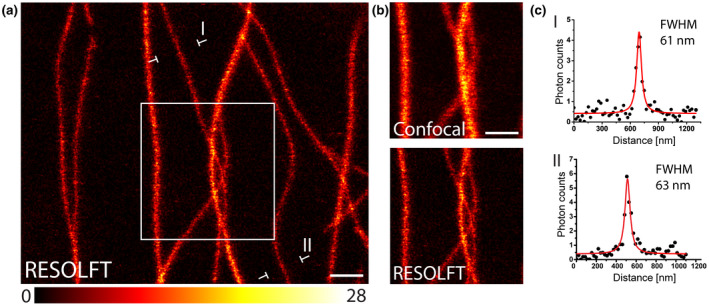
FIGURE 2.

Live‐cell RESOLFT imaging of rsEGFP2‐MAP4 labeled tubulin filaments in leaf epidermis cells of Arabidopsis thaliana. (a) RESOLFT image showing 3–4 times resolution enhancement compared to the corresponding diffraction‐limited confocal image. (b) Comparison of confocal and RESOLFT recordings from the area indicated in (a). (c) Line profiles taken at the indicated positions in (a). Each data point represents an average of five adjacent measurements, each separated by 22 nm. The averaged data were fitted with a Lorentzian function (solid red line). The FWHM was determined on the fitted function. Images display raw data without background subtraction. The colormap indicates the actual photon counts. Scale bars: 1 µm
