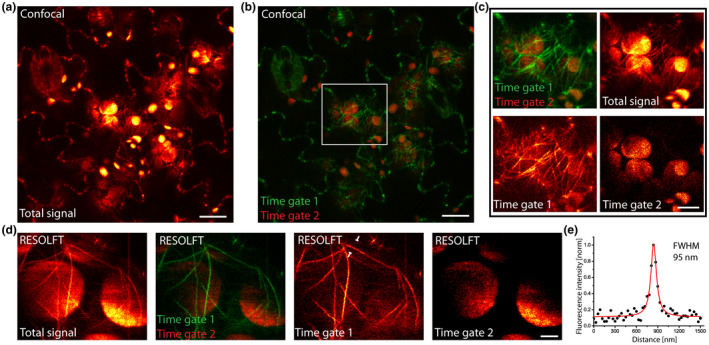
FIGURE 4.

Autofluorescence suppression by fluorescence lifetime gating. (a) Total fluorescence signal (detected at 500–550 nm) of abaxial leaf epidermis cells expressing rsEGFP2‐MAP4. Note the strong autofluorescence of the chloroplasts. (b and c) Fluorescence lifetime gating. The cellular autofluorescence and the rsEGFP2 fluorescence were separated by using distinct fluorescence lifetime gates. (b) Overlay. Autofluorescence shown in red and rsEGFP2 fluorescence in green. (c) Magnification of the area indicated in (b). Shown are the individual detection channels, their overlay, as well as the nongated fluorescence signal (total signal). (d) Fluorescence lifetime gated RESOLFT imaging. Shown are the non‐gated fluorescence signal (total signal), as well as the individual gated channels and an overlay. (e) Line profile of a filament recorded in the RESOLFT mode taken across the position indicated in (d). The data points represent an average of five adjacent measurements. The averaged data were fitted with a Lorentzian function (solid line). The FWHM was determined on the fitted function. Scale bars: 10 µm (a and b), 5 µm (c), and 2 µm (d)
