
Figure 1.
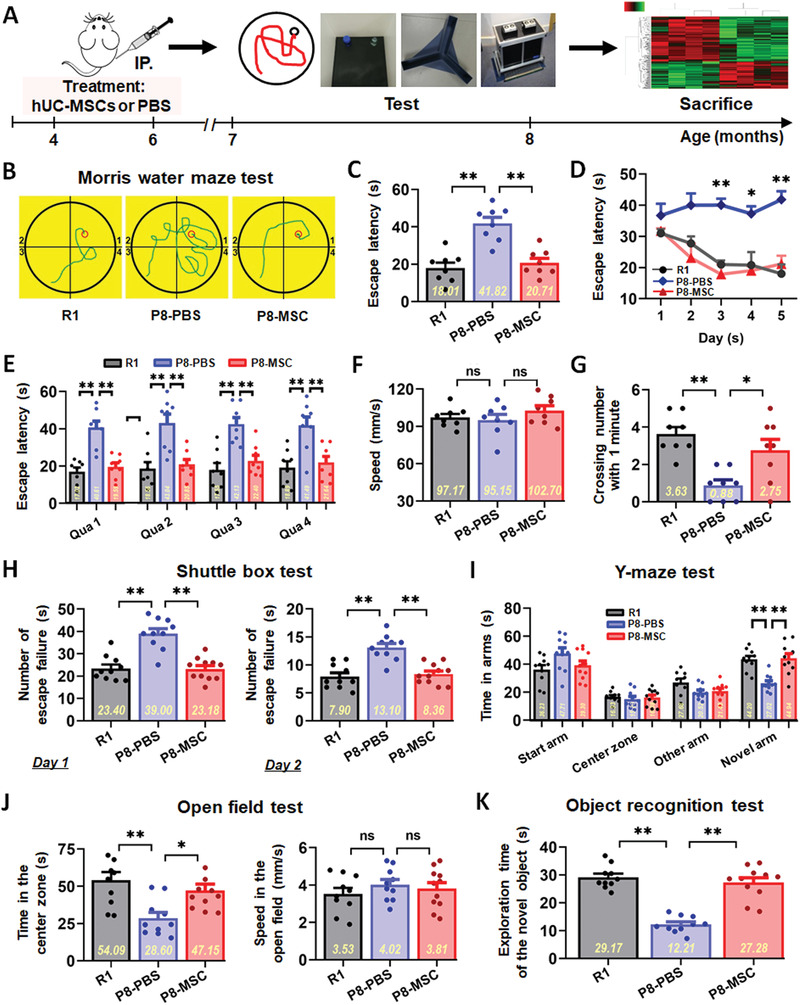
hUC‐MSCs improved spatial learning and memory ability in SAMP8 mice. A) Schematic illustrating the chronological order used for hUC‐MSCs or PBS treatment, Morris water maze (MWM), shuttle box, Y‐maze, open field and object recognition testing. B–G) Results from SAMR1 (R1), SAMP8‐PBS (P8‐PBS), and SAMP8‐MSC (P8‐MSC) groups that were cognitively tested by Morris water maze. The typical escape way (B), the escape latencies (C), and the time spend in each quadrant (abbreviated as Qua) (E) in hidden‐platform test on the fifth day. D) Learning curves show mean daily escape latencies on day 3, 4, and 5. F) There was no difference in the average locomotion velocity of three groups. G) Average number of platform crossings (swims over former platform location). H) 2 days of shuttle box test recording the number of failures in the ten successful shuttles. Records of the time of the three groups staying in the novel arm and exploring new object by I) the Y‐maze test and K) the object recognition test. J) Results from the three groups of the open field test with no different motion speed. (In each graph, the scatters represent the distribution and number of individual mice, and the bar graph shows the mean and error. n = 8–11 mice per group; all data shown as mean ± SEM, *P < 0.05, **P < 0.01).