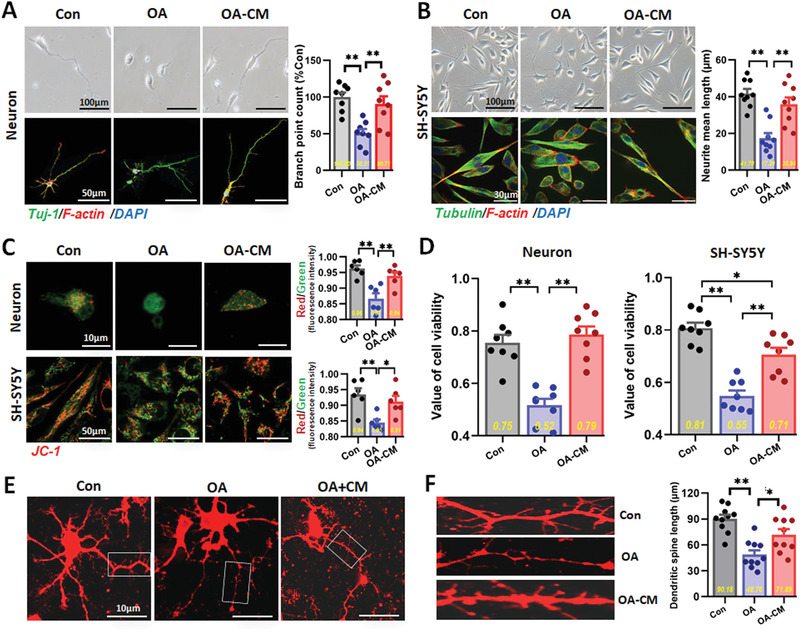
Figure 3.

hUC‐MSCs restored OA‐induced neural cell damage in an in vitro AD cell model. A) Representative optical morphological images (upper) and confocal laser scanning images (lower) of the primary neurons, and the quantification of the skeleton branch point by the high‐content cytometer and Thermo Cellomics CellInsight CX5 analysis system was showed on the right (n = 8). B) Representative morphological images of SH‐SY5Y cells observed by light microscope (upper) and immunofluorescence method (lower), and the quantification of the skeleton branch point or the neurite mean length by the high content analysis was showed on the right (n = 9 per group). C) JC‐1‐labeled the primary neurons and SH‐SY5Y cells for testing the MMP which was observed with confocal microscopy (left) and the quantification of red/green fluorescence intensity by the high‐content cytometer (right) (n = 6 per group). D) CCK‐8 assay for the viability of the neurons (left) and SH‐SY5Y cells (right) which had higher viability after CM treating (n = 8 per group). E) Confocal laser scanning images of Dil‐filled primary neurons of three groups in culture. Low‐power image of a typical, medium‐sized neuron. Analyses of spine density and morphological parameters were taken from secondary dendrites (box). F) Confocal laser scanning images and the quantification of secondary dendrites (box) from Dil‐filled primary neurons (left), and quantification of the spine length (right) by the high‐content cytometer (n = 10 per group). (All data shown as mean ± SEM, *P < 0.05, **P < 0.01).
