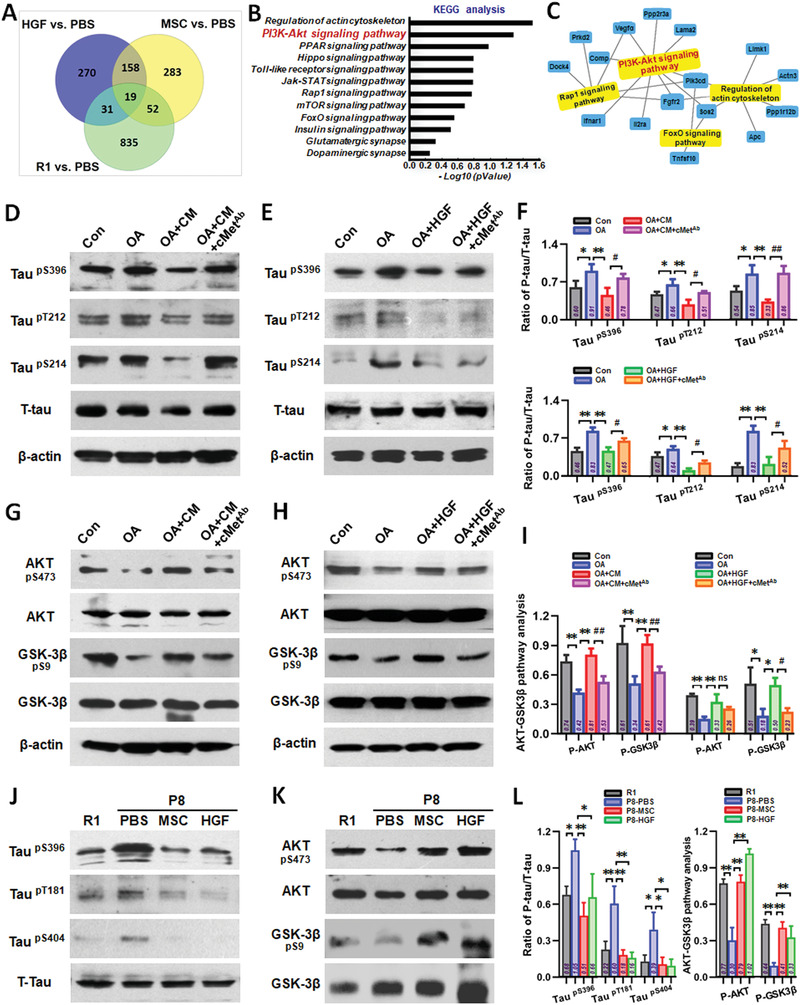
Figure 8.

The HGF‐cMet‐AKT‐GSK3β axis regulated the hyperphosphorylation of protein tau. A) Differentially expressed genes were identified using the raw data from the 16 hippocampal tissue samples. 19 different genes were obtained after a 1.5‐FC with respect to PBS group in gene expression. B) KEGG pathway analysis evaluated the enriched pathways for the representative profiles of genes involved in signal transduction pathways. C) Pathway analysis represented more genes related with PI3K‐Akt signaling pathway. D) Representative Western blotting results showing the expression of phospho‐Tau (Ser396, Thr212, and Ser214) of SH‐SY5Y cells in Con, OA, OA‐CM, and OA‐CM+cMet‐Ab groups. E) Representative Western blotting results showing the expression of phospho‐Tau (Ser 396, Thr212, and Thr214) of SH‐SY5Y cells in Con, OA, OA‐HGF, and OA‐HGF+cMet‐Ab groups. F) The quantification of phospho‐Tau (Ser396, Thr212, and Ser214) compared with total‐Tau for (D) and (E). G) Representative Western blotting results showing the expression of phospho‐AKT (Ser473) and phospho‐GSK3β (Ser9) of SH‐SY5Y cells in Con, OA, OA‐CM, and OA‐CM+cMet‐Ab groups. H) Representative Western blotting results showing the expression of phospho‐AKT (Ser473) and phospho‐GSK3β (Ser9) of SH‐SY5Y cells in Con, OA, OA‐HGF, and OA‐HGF+cMet‐Ab groups. I) The quantification of phospho‐AKT (Ser473) and phospho‐GSK3β (Ser9) respectively compared with total‐AKT and total‐GSK3β for (G) and (H). J) Phosphorylation of tau (Ser396, Thr181, and Ser404) and K) phosphorylation of AKT (Ser473), GSK3β (Ser9) in R1, P8‐PBS, P8‐MSC, and P8‐HGF mice. L) The quantification of phospho‐Tau (Ser396, Thr181, and Thr404) compared with total‐Tau (left), and the quantification of phospho‐AKT (Ser473) and phospho‐GSK3β (Ser9) respectively compared with total‐AKT and total‐GSK3β (right). (n = 3–4 per group; all data shown as mean ± SD, *P < 0.05, **P < 0.01; # P < 0.05, ## P < 0.01).
