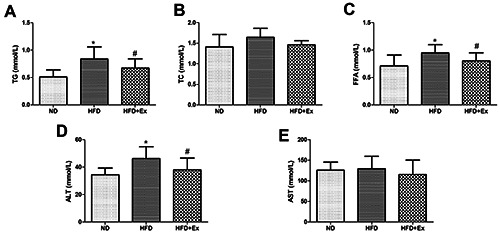
Figure 2.

GLP-1 receptor agonist ameliorated lipid profile and liver enzyme in rats. Lipid profile (A-C) liver enzymes (D,E) in three groups (n=6 per group) after 4-week drug administration. Results are expressed as the mean ± SD.*P<0.05 vs ND, #P<0.05 vs HFD; TG, triglyceride; TC, total cholesterol; FFA, free fat acid; ALT, alanine aminotransferase; AST, aspartate.
