
FIGURE 4.
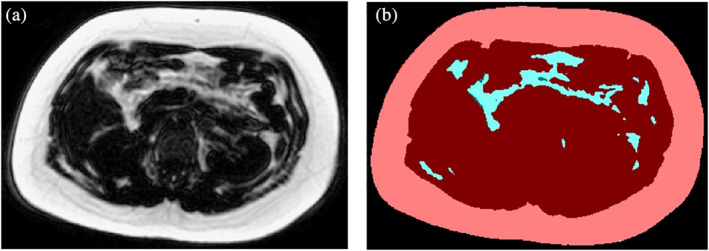
A, The original mDixon MRI fat fraction abdominal image of a single slice obtained at the level of lumbar 3 vertebrae. B, The extracted image from A, showing the subcutaneous adipose tissue (SAT) in colour pink and visceral adipose tissue (VAT) in colour blue using our validated in house method 31